docsusagenode shell
Node shell
The node shell drops you into an in-browser terminal on the EC2 host behind a Kubernetes node — over AWS SSM Session Manager, with no SSH key, no bastion, and no inbound ports. Use it when the pod-level view runs out…
The node shell drops you into an in-browser terminal on the EC2 host behind a Kubernetes node — over AWS SSM Session Manager, with no SSH key, no bastion, and no inbound ports. Use it when the pod-level view runs out of road and you need the host itself: kubelet logs, journald, containerd, a stuck EBS mount, disk-pressure forensics. The session runs under your own short-lived AWS credentials, so CloudTrail records who opened it.
This page is the user-facing tour. The operator setup guide (OIDC
provider, IAM role, Helm values) is at
docs/setup/node-shell-ssm.md.
Opening a node shell
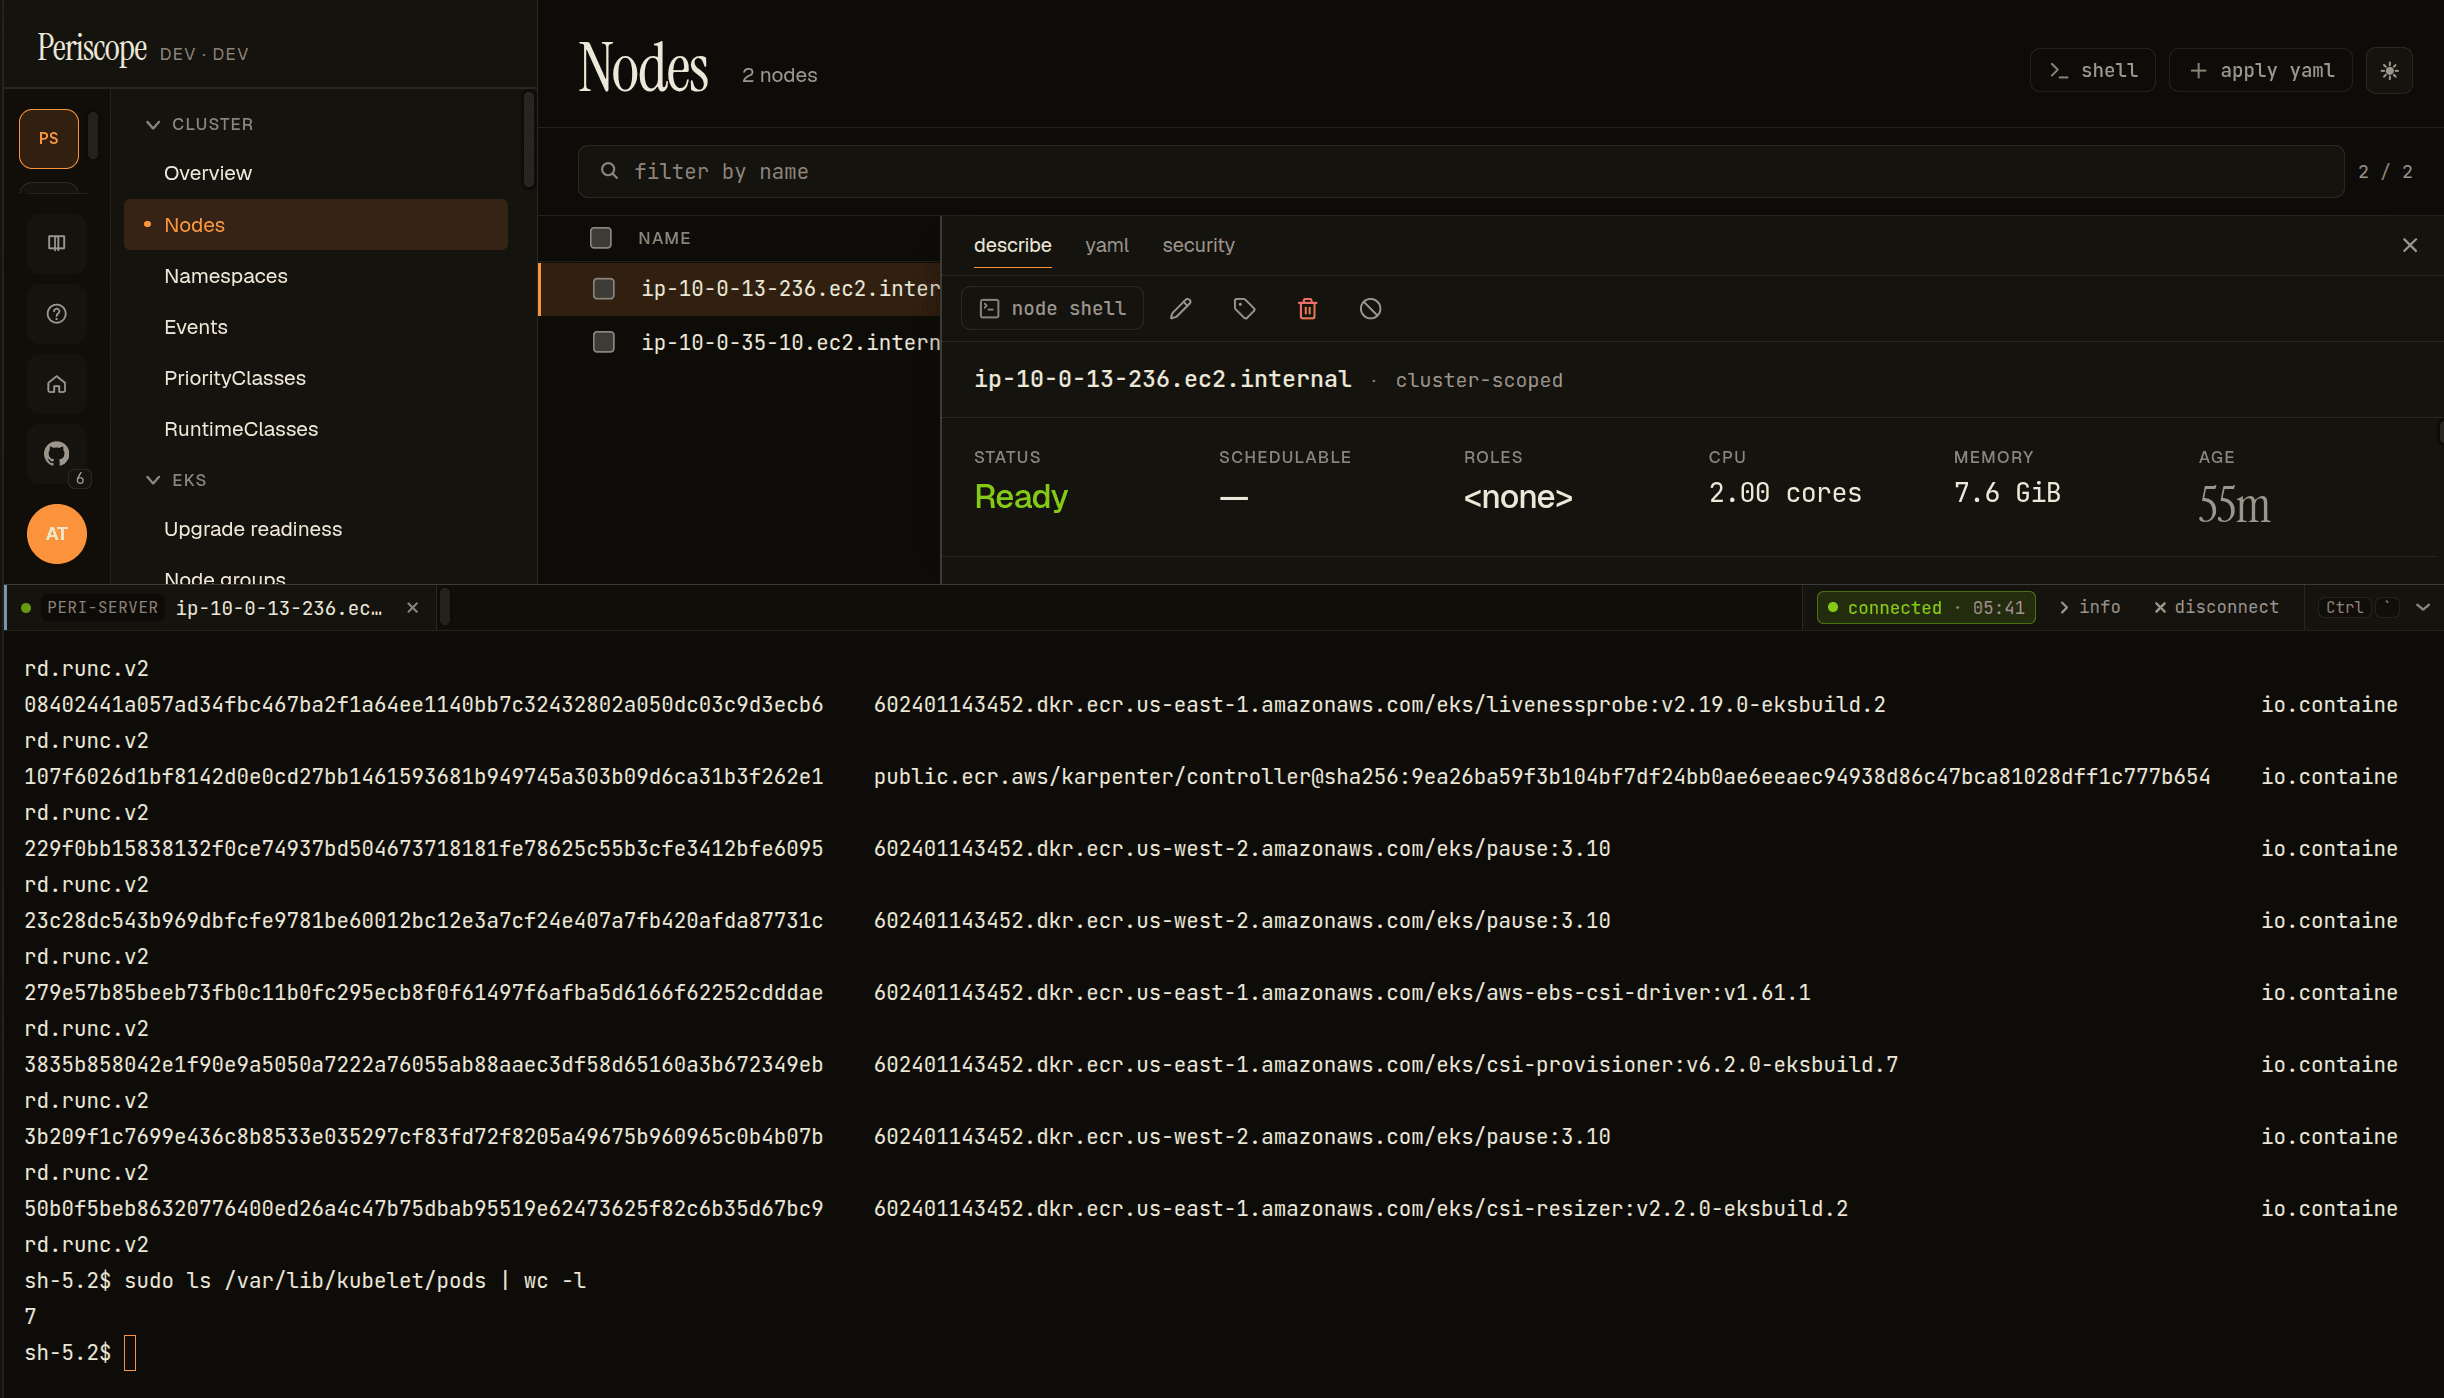
Go to Nodes, open a node's detail pane, and click node shell. A
terminal drawer slides up from the bottom; the rest of the page stays
visible above. The tab is labeled node shell; the info expander shows
the node name and (node) instead of namespace/pod/container.
First open takes a couple of seconds — Periscope exchanges your login token for AWS credentials and opens the SSM data channel.
If the button is missing, one of three gates isn't met:
- The operator hasn't enabled node shell (
nodeShell.enabled). - Your tier isn't on
nodeShell.tiers(you'd getE_FORBIDDENif you hit the endpoint directly). - The node isn't an EC2 instance — node shell only appears on nodes with
an
aws:///providerID (Fargate and non-EKS nodes are excluded).
What you land in
You get a shell on the actual worker node, not a container:
Starting session with SessionId: periscope-<your-oidc-sub>-...
sh-5.2$
You're the SSM session user (ssm-user on EKS AL2023, with sudo). This
is the host — crictl, journalctl -u kubelet, /var/lib/kubelet, and
dmesg all work, none of which exist inside a pod.
whoami says ssm-user, not you — that's expected. SSM uses a
generic session account. Attribution lives in the trail, not the
prompt: the per-user role-session-name carries your OIDC sub — the
IdP user id (e.g. auth0|69f5…), not an email or display name — so
CloudTrail records the session as
assumed-role/<role>/periscope-<sub>, and Periscope's own audit log
records the same session id. The shell is generic; the record is yours.
What you can do
Host-level debugging that pods can't reach. Some real patterns:
# kubelet — the logs you literally cannot get via kubectl
sudo systemctl status kubelet --no-pager
sudo journalctl -u kubelet -p warning --since "15 min ago" --no-pager
sudo journalctl -u kubelet -f

# container runtime
sudo crictl ps                       # containers actually on this node
sudo crictl stats
sudo journalctl -u containerd -n 40 --no-pager

# node pressure (the classic "why is this node NotReady")
df -h /                              # disk pressure is the #1 eviction cause
free -h ; uptime
sudo journalctl -k -p err -n 20 --no-pager   # kernel / OOM-kill lines

# EKS bootstrap + CNI
cat /etc/eks/release
sudo journalctl -u nodeadm-config -u nodeadm-run --no-pager | tail -30
Everything you type is captured to a per-session transcript (capped at
nodeShell.transcriptMaxBytes) and attached to the ssm_session_close
audit row when the session ends.
The two audit trails
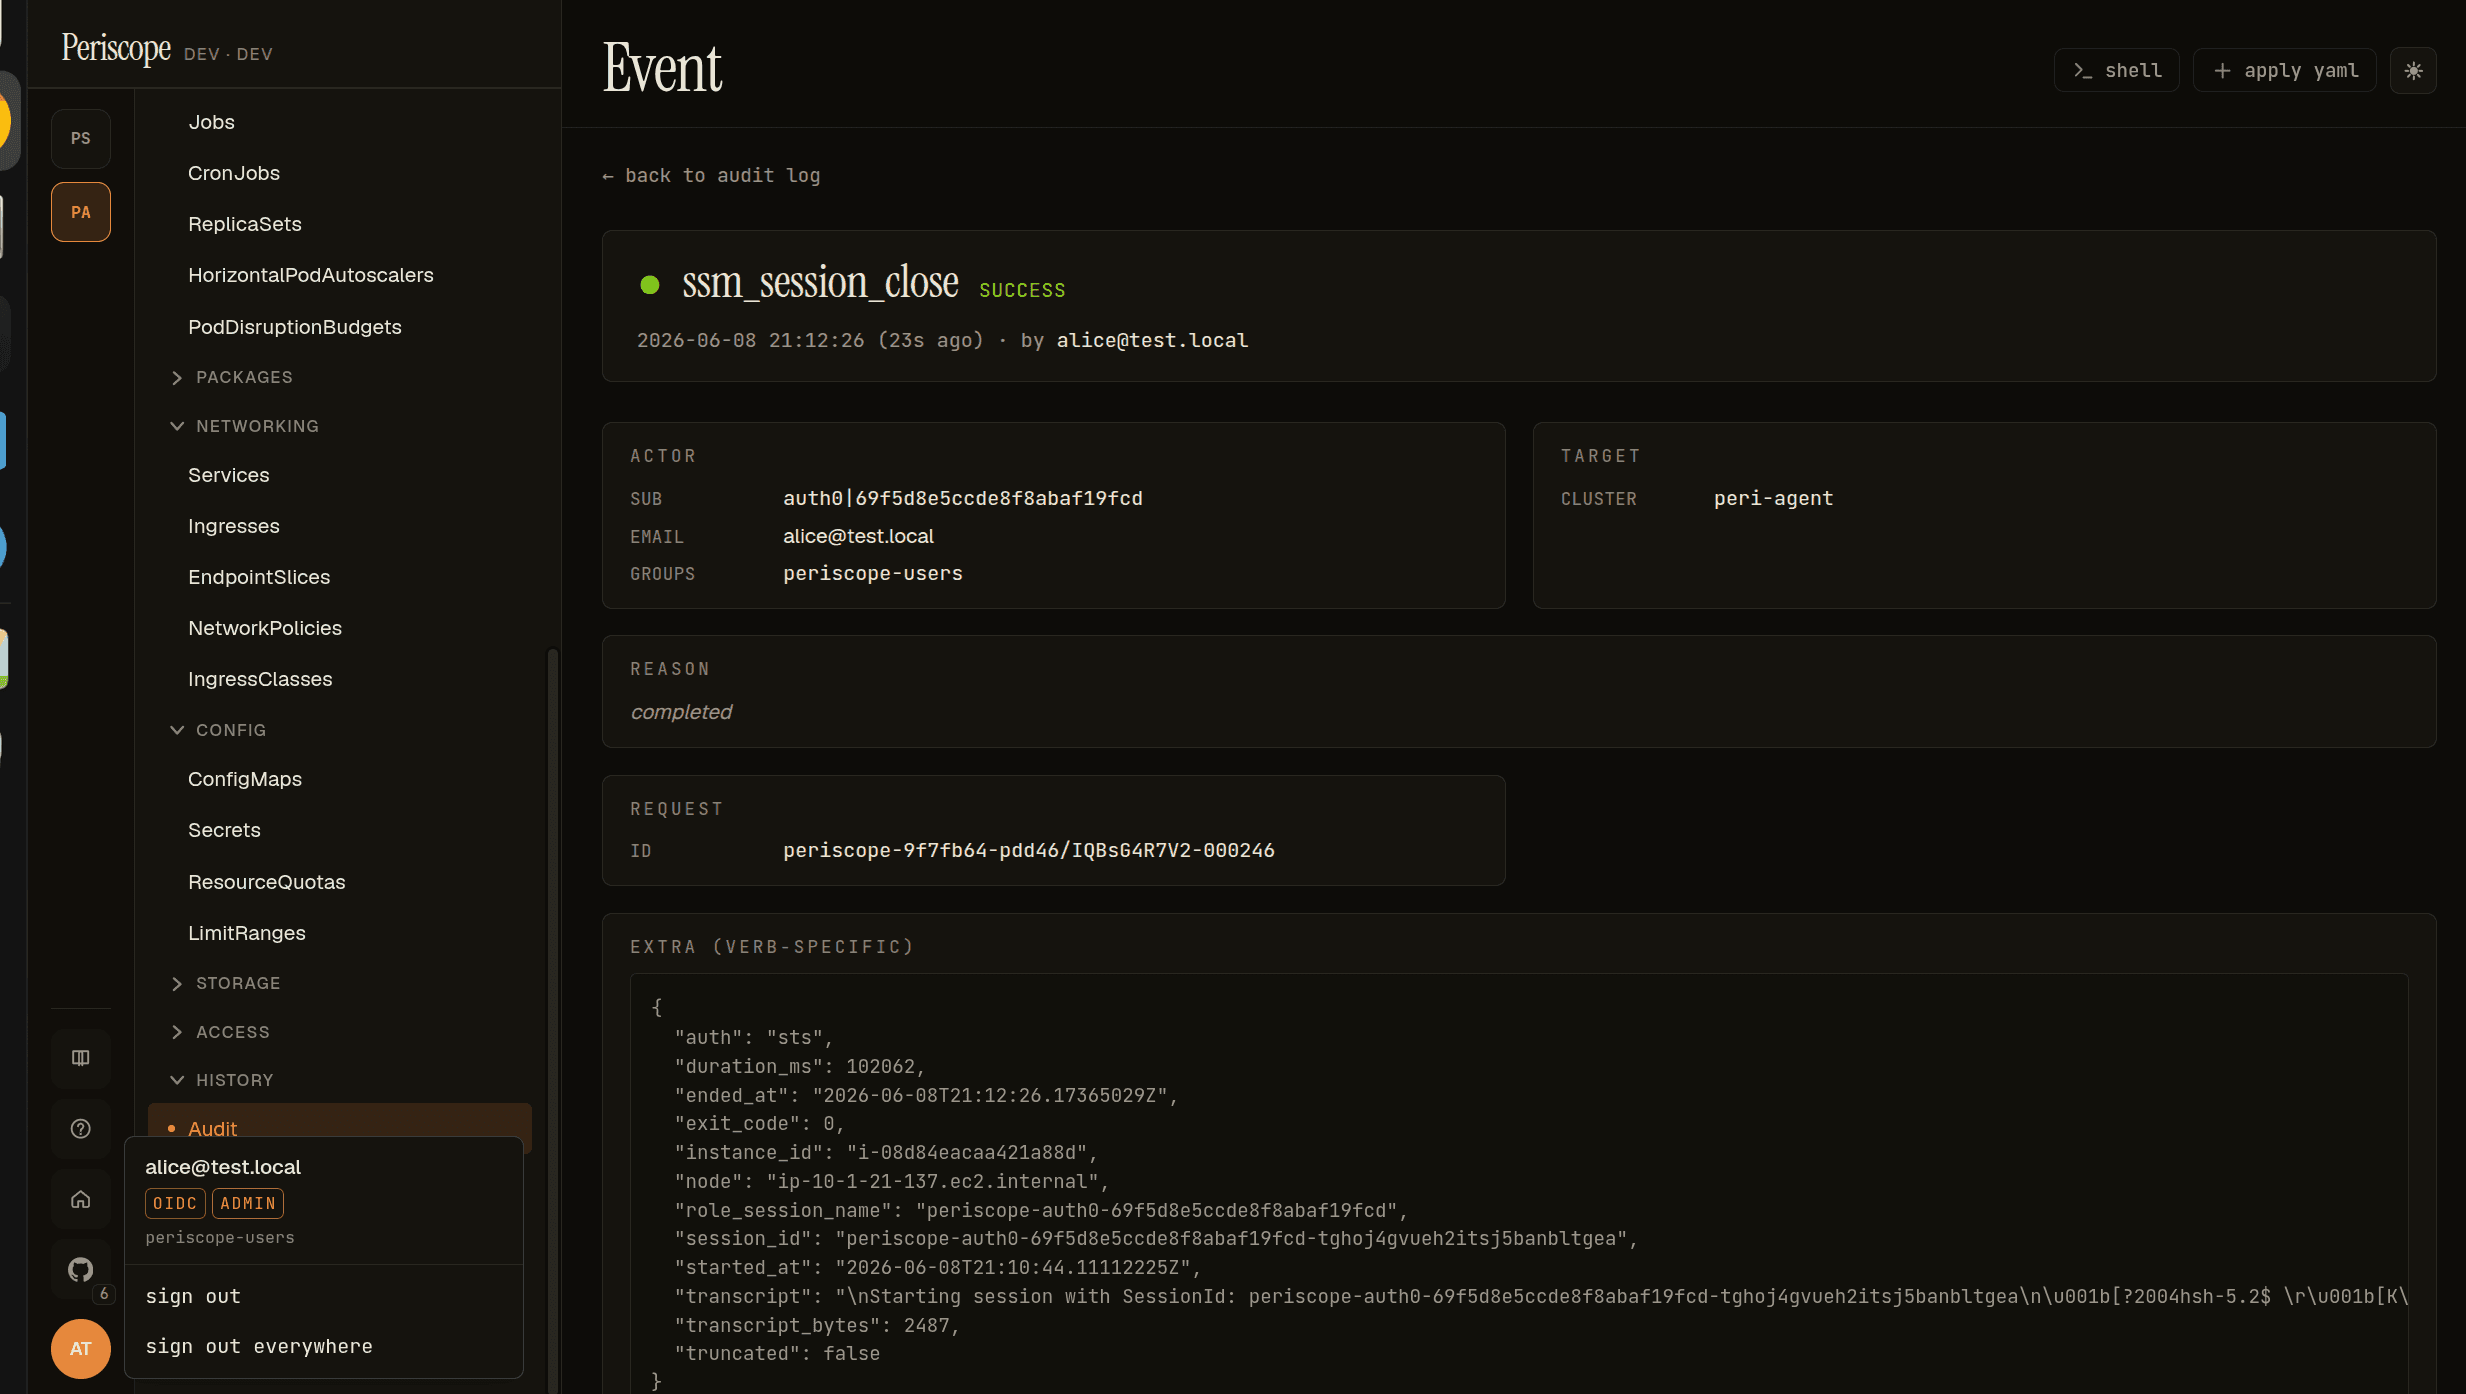
Every session writes two Periscope audit rows — ssm_session_open and
ssm_session_close — carrying your identity, the instance id, duration,
exit code, and (on close) the transcript. On the AWS side, CloudTrail
records each StartSession under your per-user assumed-role session:
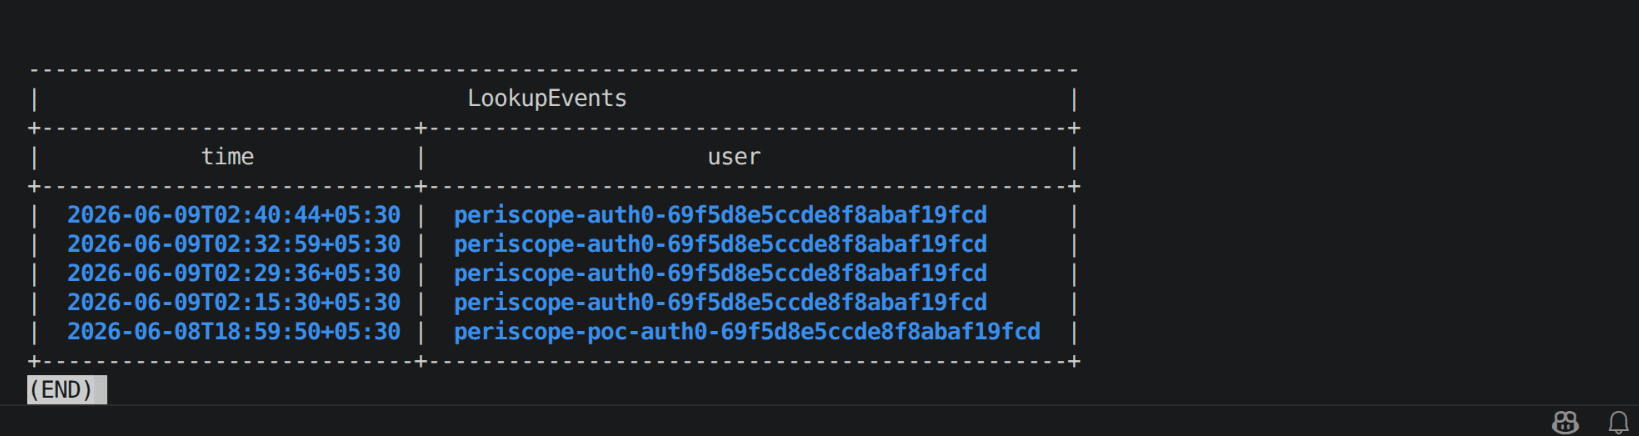
The two join on the role-session-name / session_id — one human, two
logs, one grep.
Caps and idle behavior
Per Periscope-server defaults (your operator may have changed them):
- 2 concurrent sessions per user, across all clusters
(
nodeShell.maxSessionsPerUser) - 10 concurrent sessions total (
nodeShell.maxSessionsTotal)
Idle timeout: the session closes after 10 minutes of no activity
(nodeShell.idleSeconds, default 600). The session also closes on exit
/ Ctrl-D, browser tab close, or a Periscope-server restart.
Compared to the other shells
| Node shell | Cluster shell | Pod exec | |
|---|---|---|---|
| Where you launch it | Node detail pane | Cluster page header | Pod detail page |
| Where you land | The node's EC2 host (SSM) | A fresh ephemeral pod | An existing container |
| Identity model | Per-user AWS assumed role (OIDC→STS) | Per-user K8s impersonation | Per-user K8s impersonation |
whoami | ssm-user (you're in CloudTrail) | root in the pod (you're at apiserver) | container's user |
| Needs | EC2 node + SSM agent Online | tier mode + RBAC | container + RBAC |
| Default idle cut | 10 min | 20 min | 10 min |
All three coexist as separate tabs in the same drawer. Reach for the node shell when the problem is below Kubernetes — the kubelet, the runtime, the disk, the network stack on the box itself.
Security note
The Periscope pod has no SSM permissions of its own. A node shell can only open by presenting your live OIDC id_token, which AWS validates against the IAM trust policy before issuing the short-lived role credentials. So a compromised Periscope pod cannot reach a node, and every session is attributed to the human who opened it.
Anyone authorized to open a node shell has host-level access to the box
(the generic ssm-user, with whatever sudo the node grants). Scope
nodeShell.tiers accordingly. The full threat model is in the operator
guide at
docs/setup/node-shell-ssm.md#8-limitations-and-threat-model.