docsusagecluster overview
Cluster overview
The cluster overview is the page you land on after clicking a cluster card in the fleet view. It combines K8s state (capacity, pod phases, workload counts) with EKS-side state (upgrade readiness, node-group drift, add…
The cluster overview is the page you land on after clicking a cluster card in the fleet view. It combines K8s state (capacity, pod phases, workload counts) with EKS-side state (upgrade readiness, node-group drift, add-on health) on a single page so an operator preparing an upgrade can answer "are my manifests OK and are my nodes / add-ons current?" without clicking around.
What you see
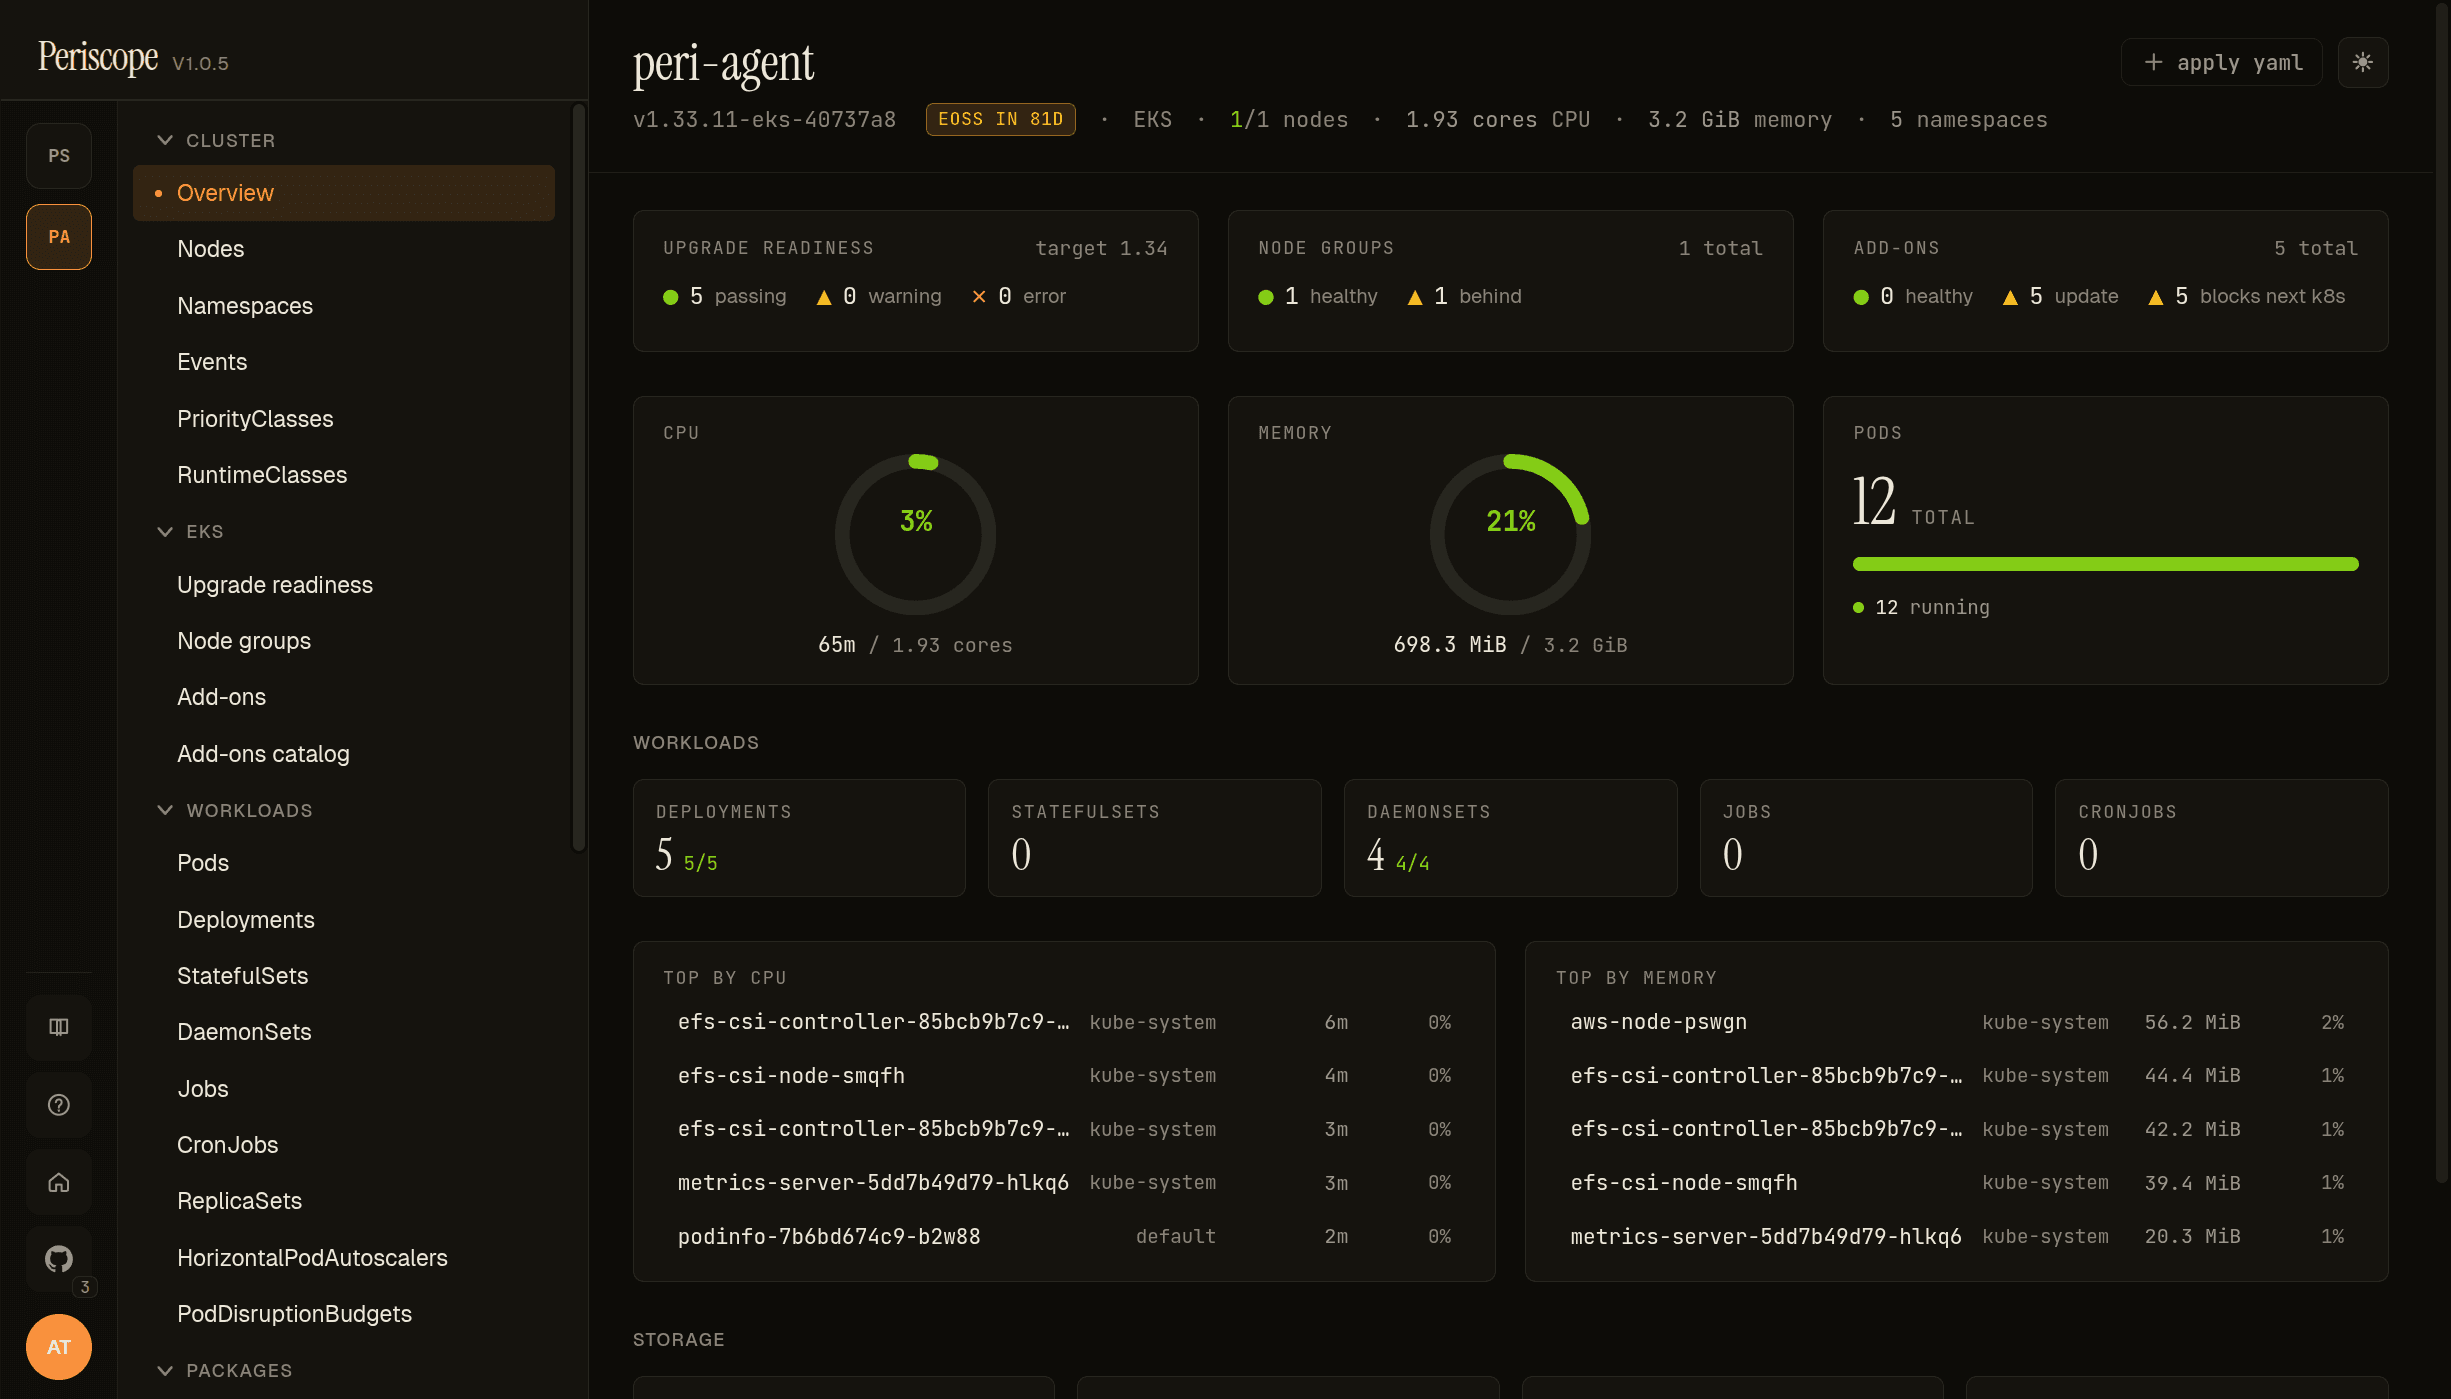
The page is read-top-to-bottom by intent:
Identity banner — the strip at the top carries the cluster name,
K8s version (from the apiserver's /version endpoint), an
EoSS chip when standard support ends within 180 days, the
provider (EKS or Kubeconfig), the ready/total node count,
CPU / memory allocatable, and namespace count. Forbidden
states (node access restricted, namespace access restricted)
render in italic when the operator's RBAC denies the underlying
list call — distinguishing "empty cluster" from "hidden by RBAC."
EKS row — three cards side-by-side: Upgrade readiness, Node groups, Add-ons. Each summarises its respective deeper page in 2-3 lines (e.g. "3 healthy · 1 behind · 1 custom" for node groups). Cards are absent for non-EKS-capable clusters.
Capacity row — three gauges: CPU, memory, pod phase distribution. CPU and memory require metrics-server; absent state is messaged inline with an install hint instead of zeroes that look like idle.
Workloads — a card per K8s kind (Deployments, StatefulSets, DaemonSets, Jobs, CronJobs, Pods) with healthy / total fractions. Click a card to drill into the matching list page.
Needs attention — curated list of pods that are reporting a
wait/term reason kubectl marks as broken (CrashLoopBackOff,
ImagePullBackOff, RunContainerError, Error,
ContainerCannotRun). Capped at 20; each entry deep-links to the
pod detail with the describe tab open.
Top consumers — top 5 pods by CPU and by memory, only when
metrics-server is reachable. Each row shows usage in absolute
(350m, 512Mi) plus a percentage of the pod's limit (or of
cluster allocatable when the pod has no limit).
Storage — PV + PVC snapshot (details). Counts of bound / pending, allocated capacity by storage class.
Recent events — last 20 cluster events (newest first). Tied to
the same SSE stream the dedicated Events page uses.
Refresh cadence
The page is built from the
/api/clusters/{cluster}/dashboard endpoint plus an
SSE event stream. The dashboard endpoint is cached per-actor for
30 seconds; the event stream is live. Most cards refresh in place
without flicker — if a count changes between two refresh ticks,
only the affected number animates.
RBAC
The page shows what the impersonated operator's tier can see. A
read-tier operator sees the dashboard but Top consumers is
empty if the role lacks metrics.k8s.io/pods; Needs attention
is empty if the role lacks pods/list (rare). The page does not
fan-out additional API calls beyond what the dashboard endpoint
issues, so there's nothing extra to grant.