docsusagekarpenter view
Karpenter dashboard — NodePools, NodeClaims, pending pods
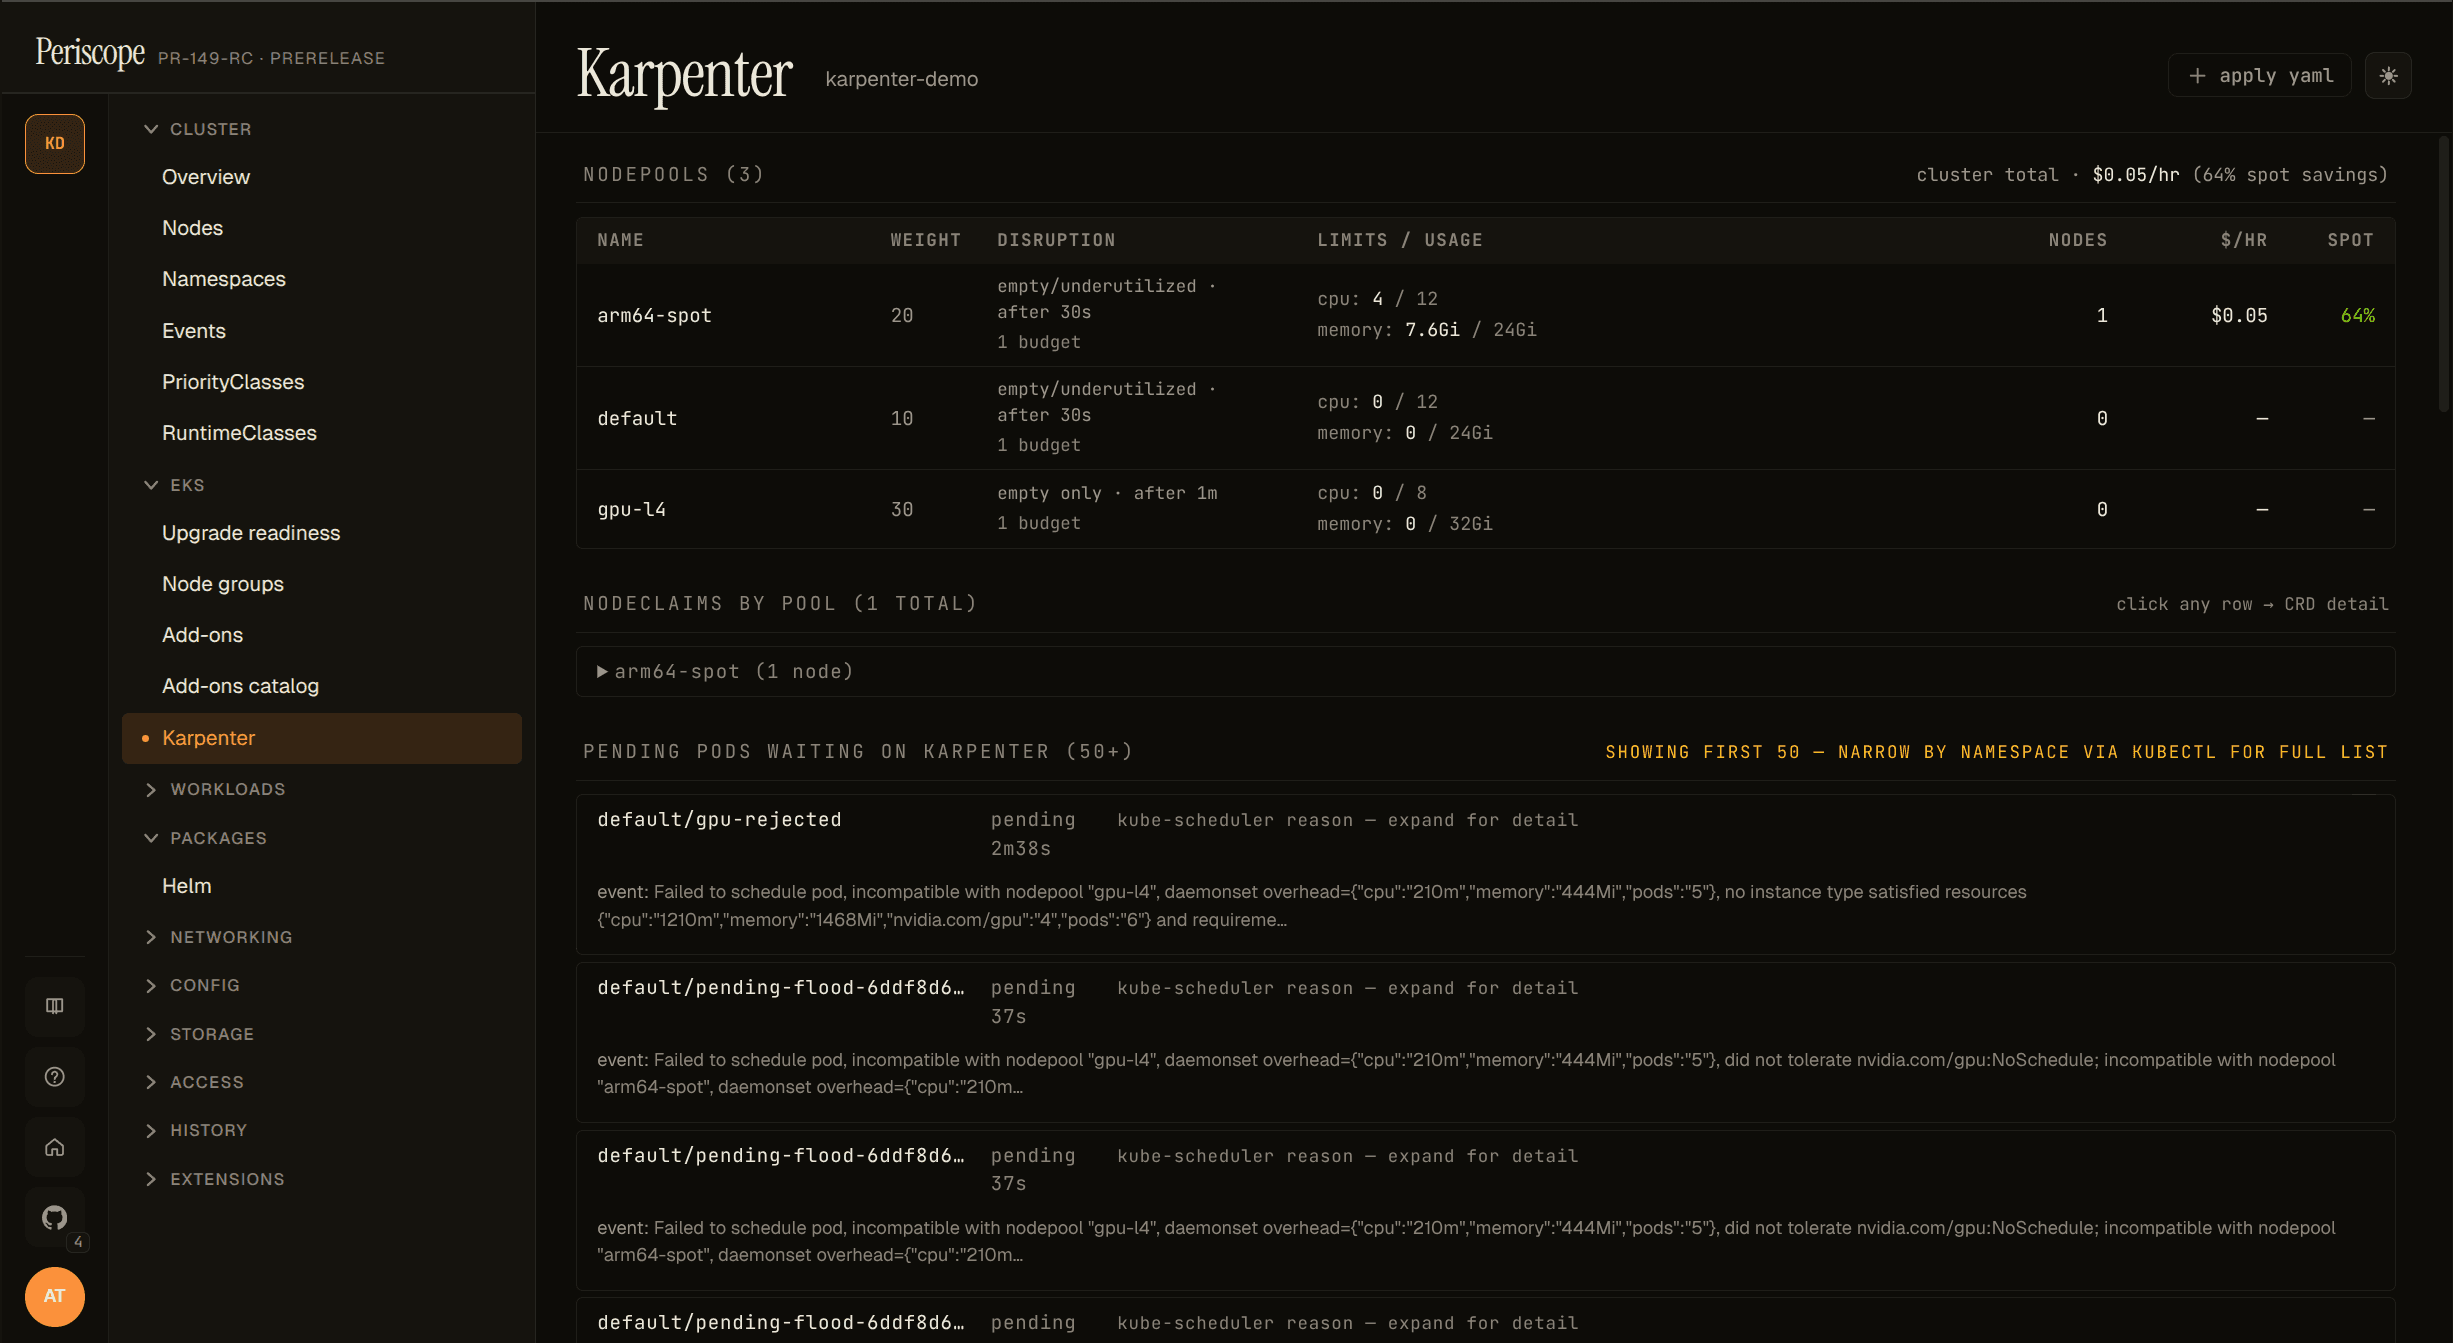
Periscope's Karpenter view: NodePools with $/hr + spot savings, NodeClaims grouped by pool, pending pods with scheduling reasons. Read-only joins kubectl can't do, on one page.
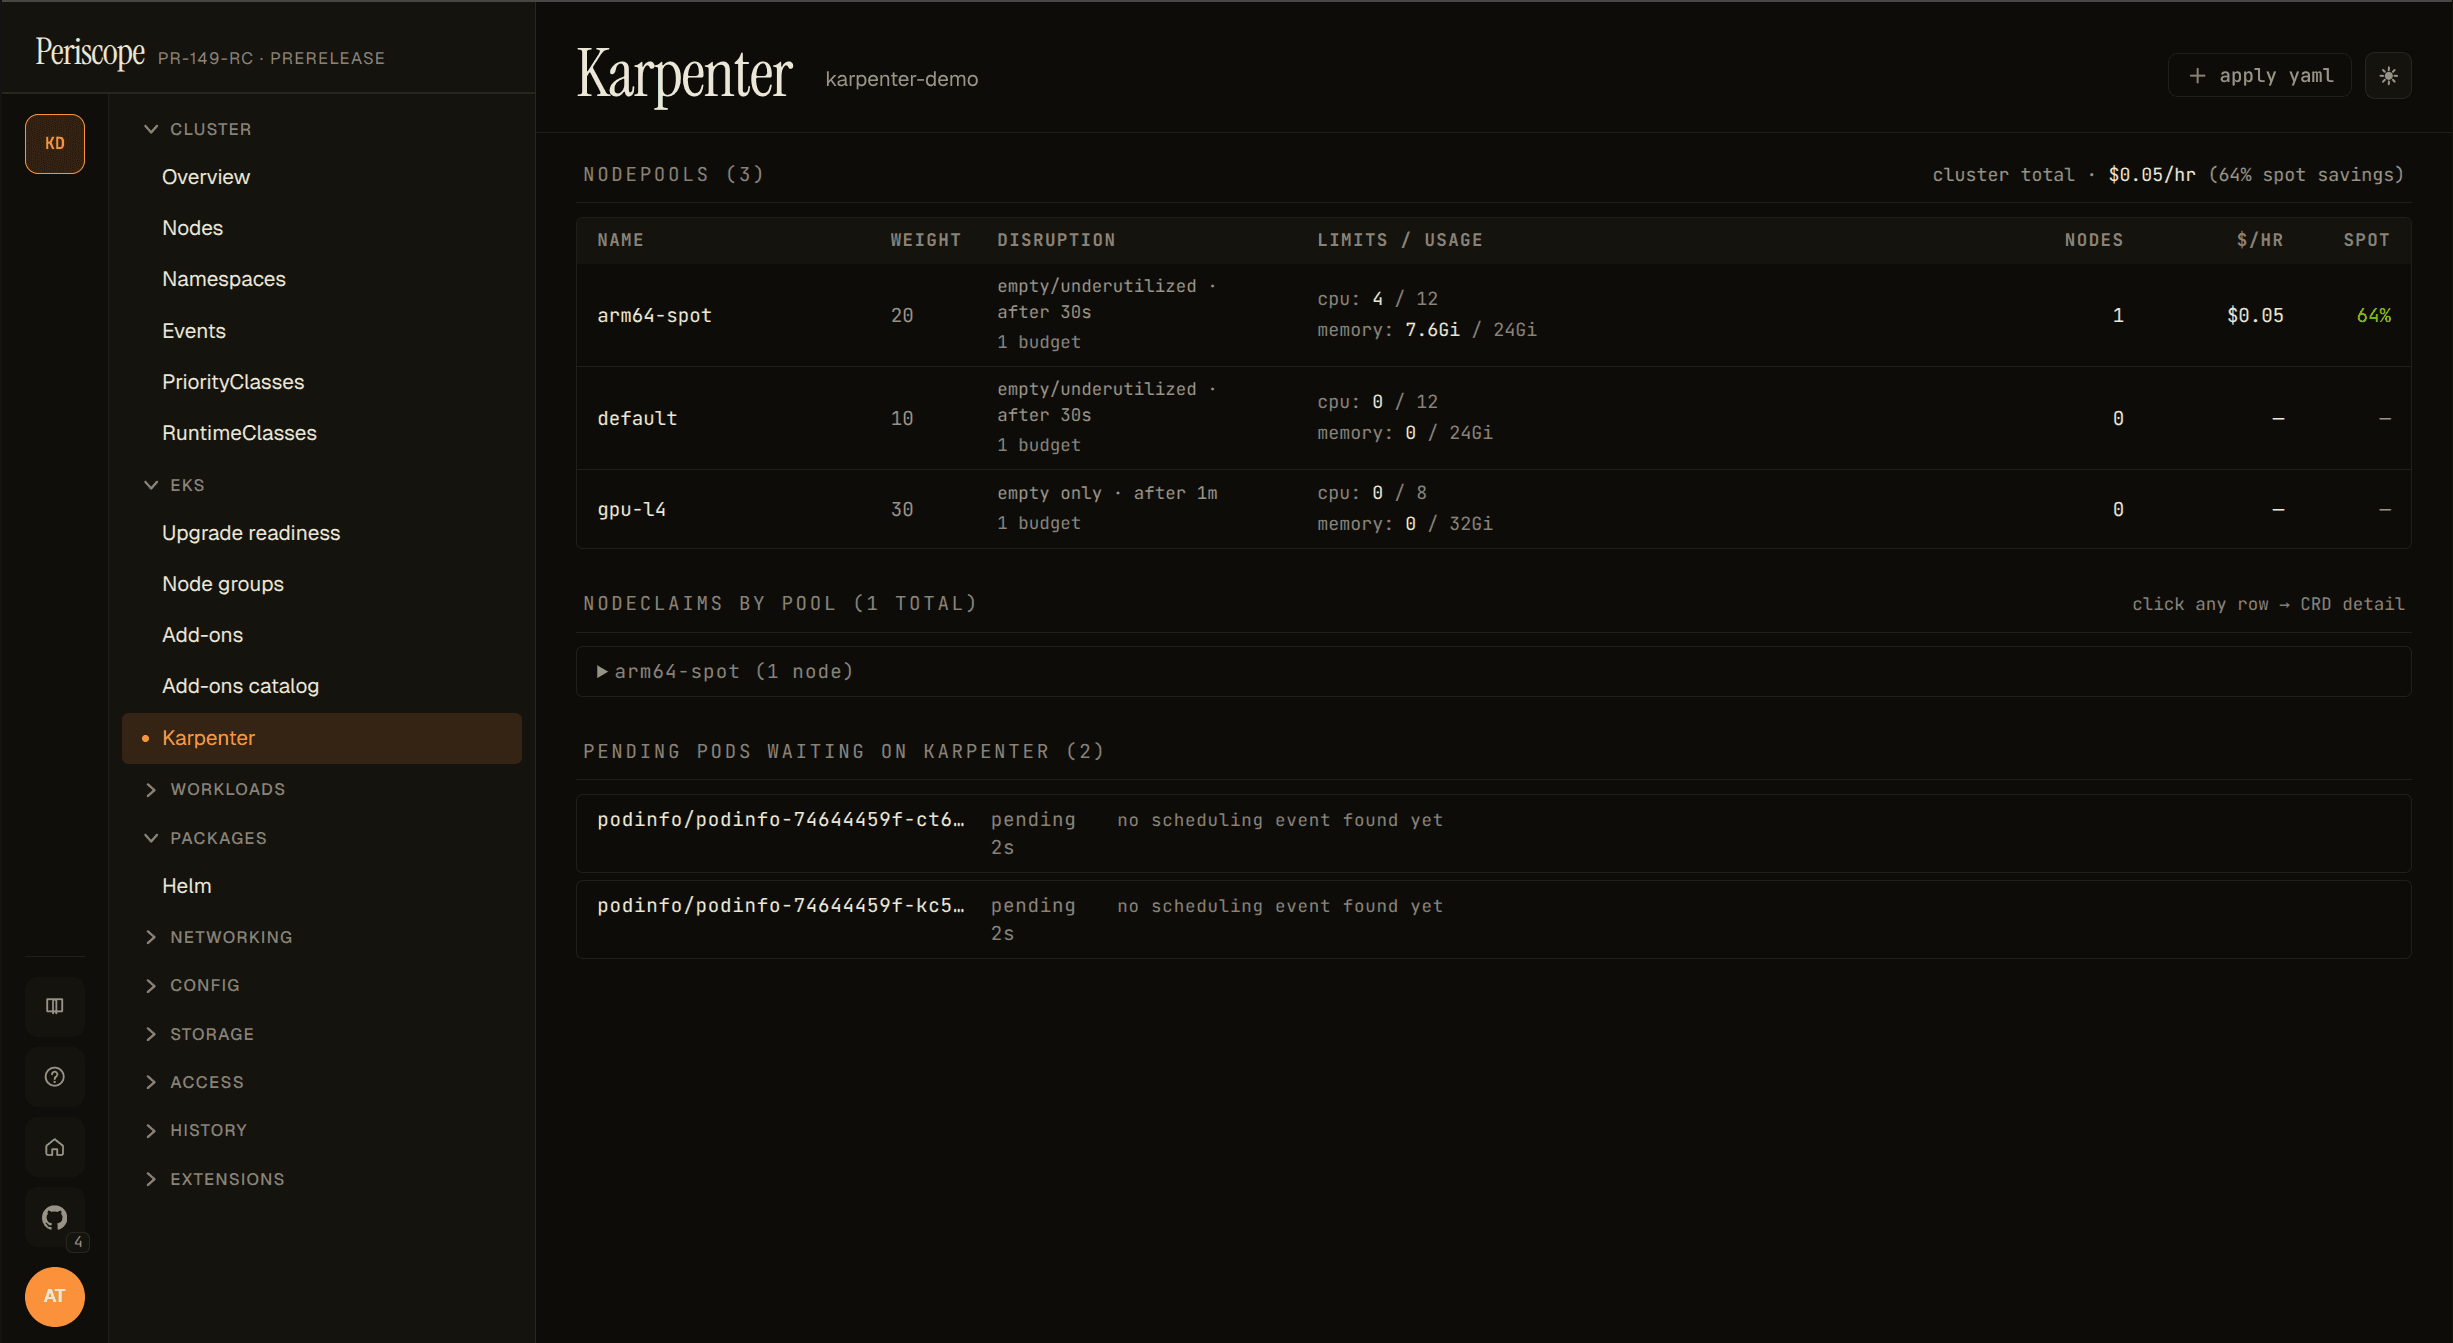
Periscope's Karpenter view is a curated read-only page at
/clusters/{cluster}/karpenter that joins three data sources kubectl
can't:
- NodePools — weight, disruption knobs, current/limit usage,
and per-pool
$/hr+ spot-savings (when controller metrics are reachable). - NodeClaims grouped by NodePool — per-node instance type, capacity type (spot / on-demand), zone, and the K8s status conditions that matter (Drifted, Initialized, Launched).
- Pending pods waiting on Karpenter — the per-NodePool
incompatibility breakdown extracted from
FailedSchedulingapiserver Events. Operators no longer have to grep karpenter-controller logs to find out why a pod isn't being scheduled.
The page auto-detects via the discovery API. The sidebar entry only
appears on clusters with karpenter.sh/v1 CRDs installed.
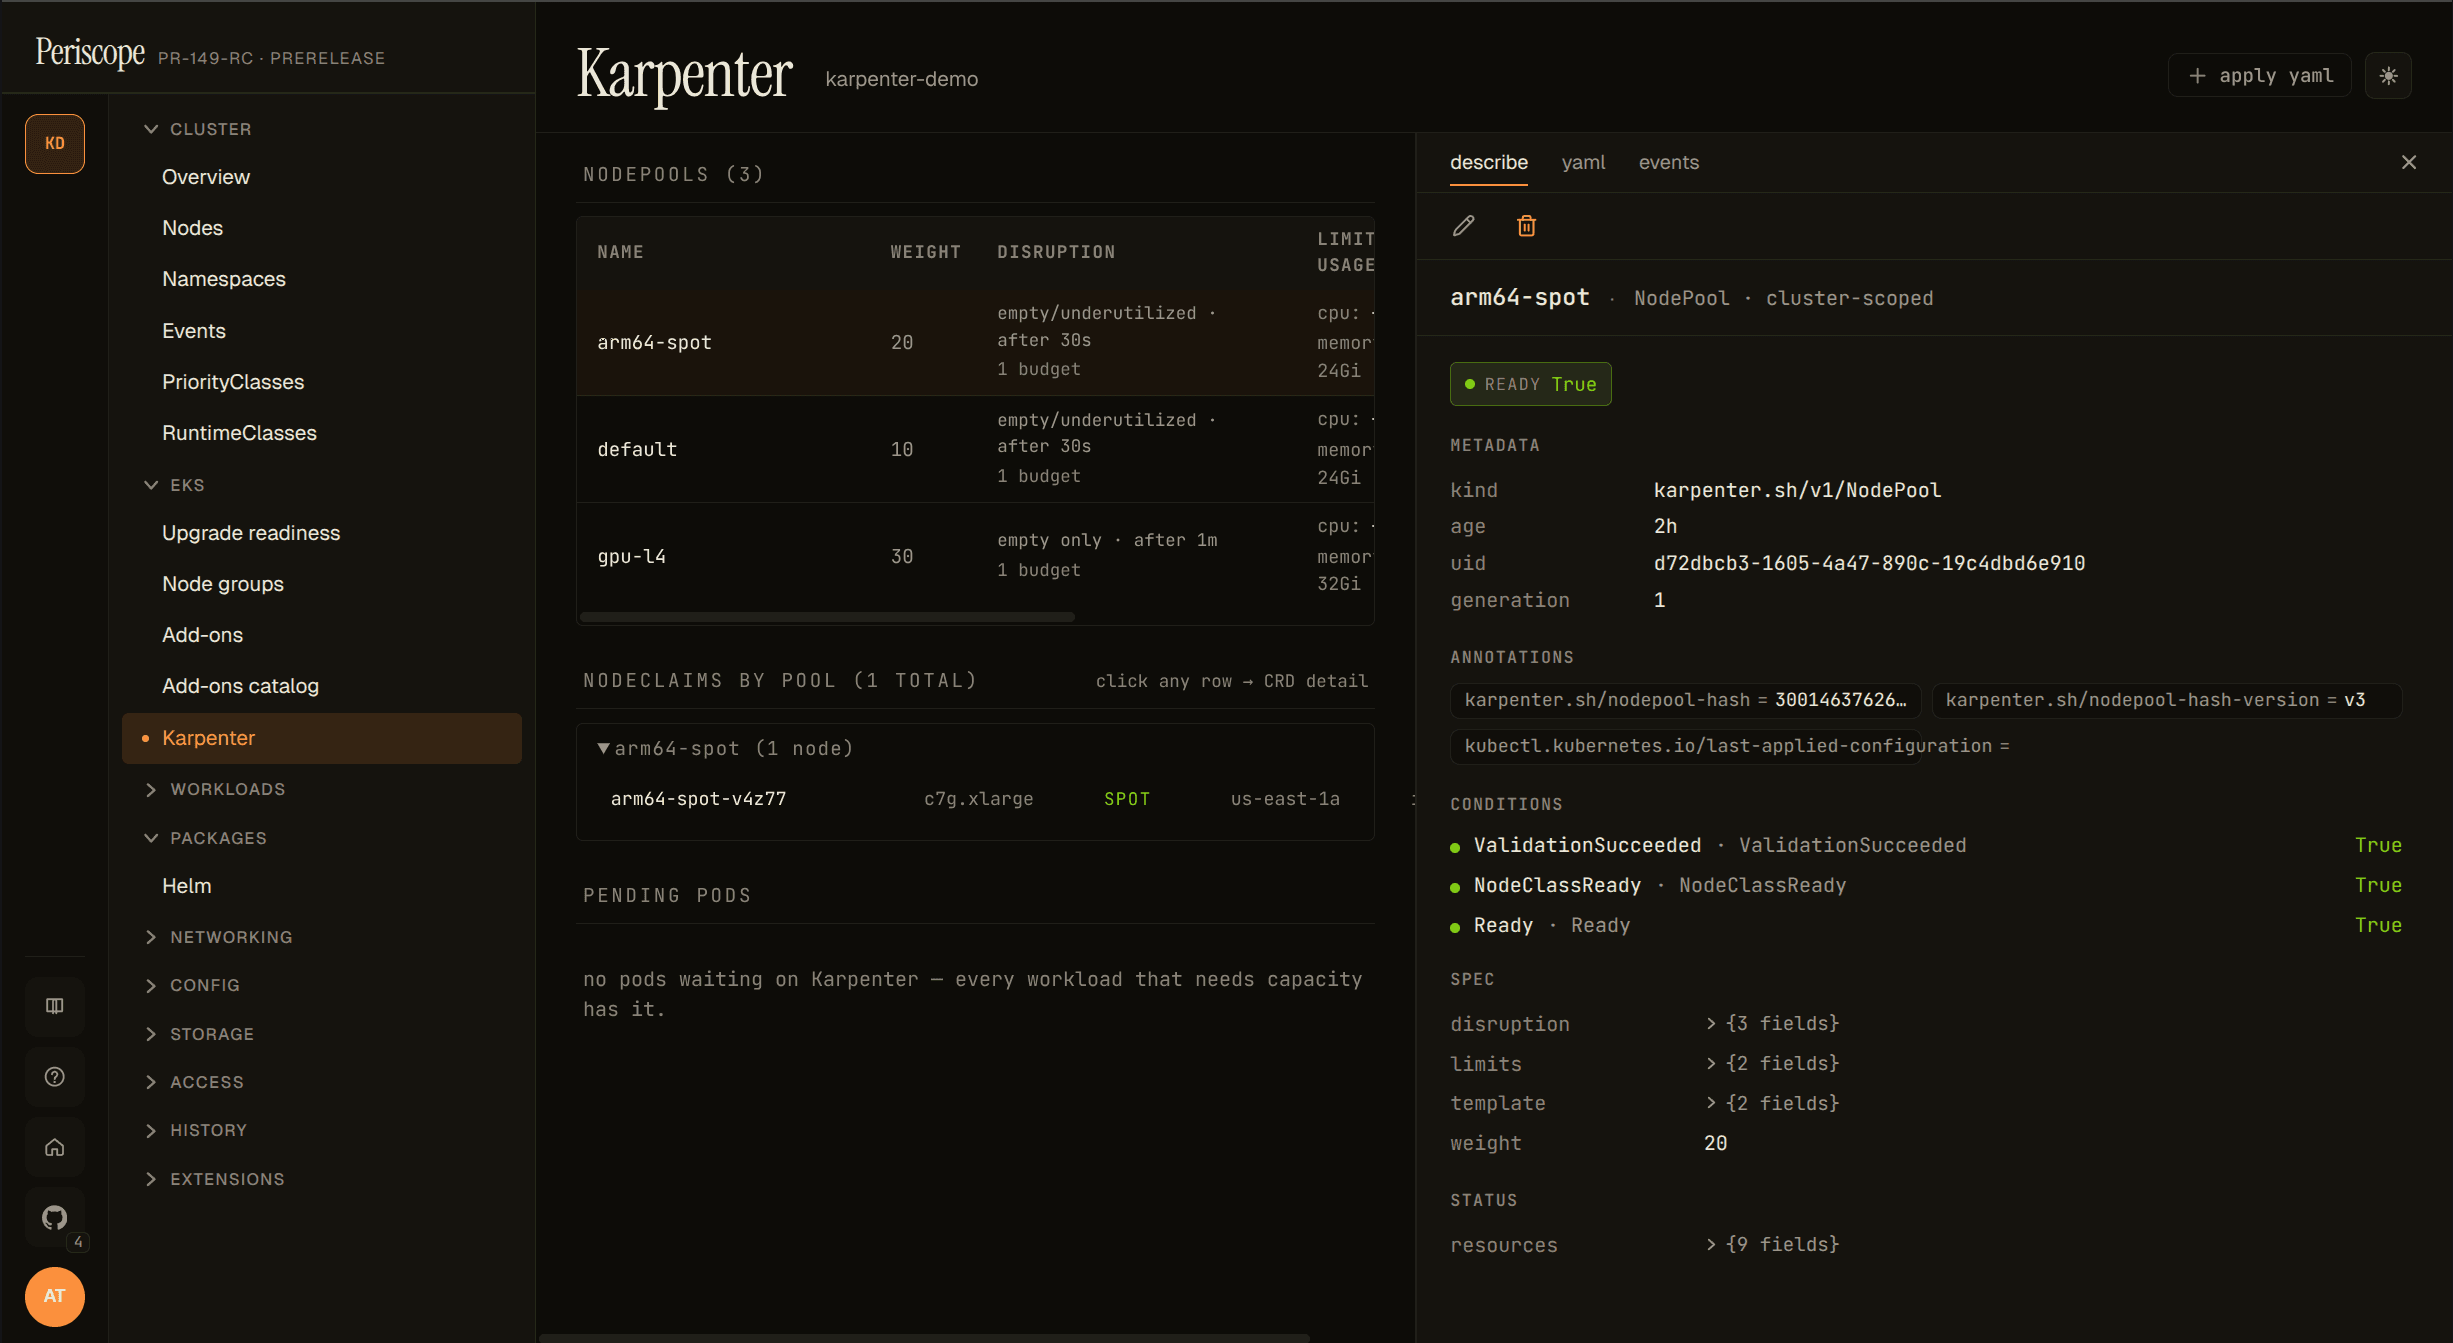
Clicking any NodePool or NodeClaim row opens a resizable detail pane on the right with describe, yaml, and events tabs — operators stay on the Karpenter page instead of bouncing into the generic CRD catalog. Pane width persists across page refreshes.
When the sidebar entry doesn't appear
| Cause | Fix |
|---|---|
| Karpenter not installed | Install per https://karpenter.sh/docs/getting-started/; the sidebar lights up on next page reload. |
| Karpenter installed but on v1beta1 / v1alpha5 | Migrate to v1 (the v1 GA shipped 2024-07). The dashboard targets v1 only — v1beta1 clusters can still use the generic CRD viewer at /clusters/{c}/customresources/karpenter.sh/v1beta1/nodepools. |
| Operator's RBAC blocks the discovery API | Periscope impersonates the operator on every K8s call. The CRD probe needs get on customresourcedefinitions.apiextensions.k8s.io. |
When the cost columns don't render
The $/hr and spot % columns appear when Periscope's backend
successfully scrapes the karpenter-controller's /metrics endpoint
via the apiserver service-proxy. When that scrape fails, the columns
are hidden and a yellow "metrics unreachable" hint appears above the
table. Common causes:
- Karpenter installed in a non-default namespace. Periscope looks
for the controller Service at
karpenter/karpenter:8080. If the helm release was installed under a different namespace or withcontroller.metrics.serviceMonitor.endpointConfig.targetPortset to something other than 8080, the scrape fails. Reinstall with the default chart values OR file a follow-up issue if you need a configurable namespace. - Operator's RBAC lacks
services/proxy. The cost scrape uses the apiserver's service-proxy verb so the call respects user impersonation. If your operator's bound role doesn't includeservices/proxyin the karpenter namespace, the scrape returns 403 and the columns are hidden. The shipped tier ClusterRoles don't includeservices/proxyby default (it's a privileged verb), so this almost always needs an explicit binding. Applyexamples/karpenter-cost-rbac.yamlfor a copy-pasteable Role + RoleBinding scoped to the karpenter namespace; the rest of the dashboard works without it. - Cluster-SG → node-SG ingress missing. The apiserver-proxy
request lands on the karpenter pod via the node's security group;
if the rule allowing the cluster security group to reach the node
SG on TCP
1025-65535was dropped (some terraform-aws-modules versions stop creating it implicitly), the proxy hangs and the scrape times out. Runaws ec2 describe-security-group-rules --filters Name=group-id,Values=$NODE_SGto confirm the rule exists; if it's missing, add it withaws ec2 authorize-security-group-ingress --group-id $NODE_SG --source-group $CLUSTER_SG --protocol tcp --port 1025-65535. - NetworkPolicy blocks apiserver → karpenter Service. If your cluster restricts apiserver egress to only specific namespaces, add the karpenter namespace to the allowlist. (Rare — most clusters allow apiserver-initiated traffic by default.)
- Cold-start race. On the first page load after a fresh apiserver
pod (or a periscope rollout), the apiserver→karpenter
/metricsproxy call sometimes exceeds the handler's 15-second budget while TLS handshake + connection establishment warms up. The dashboard auto-refetches every 12 seconds, so cold-start emptiness self-heals on the next poll without an operator refresh.
The dashboard's other panels (NodePools list, NodeClaim grouping, pending pods) all render normally without metrics — the cost summary is the only thing affected.
Pending pods panel
The most operationally-useful panel. Each row is one pod stuck
Pending; clicking the row reveals the per-NodePool rejection
reasons that Karpenter logged via the FailedScheduling apiserver
Event. Example expanded row:
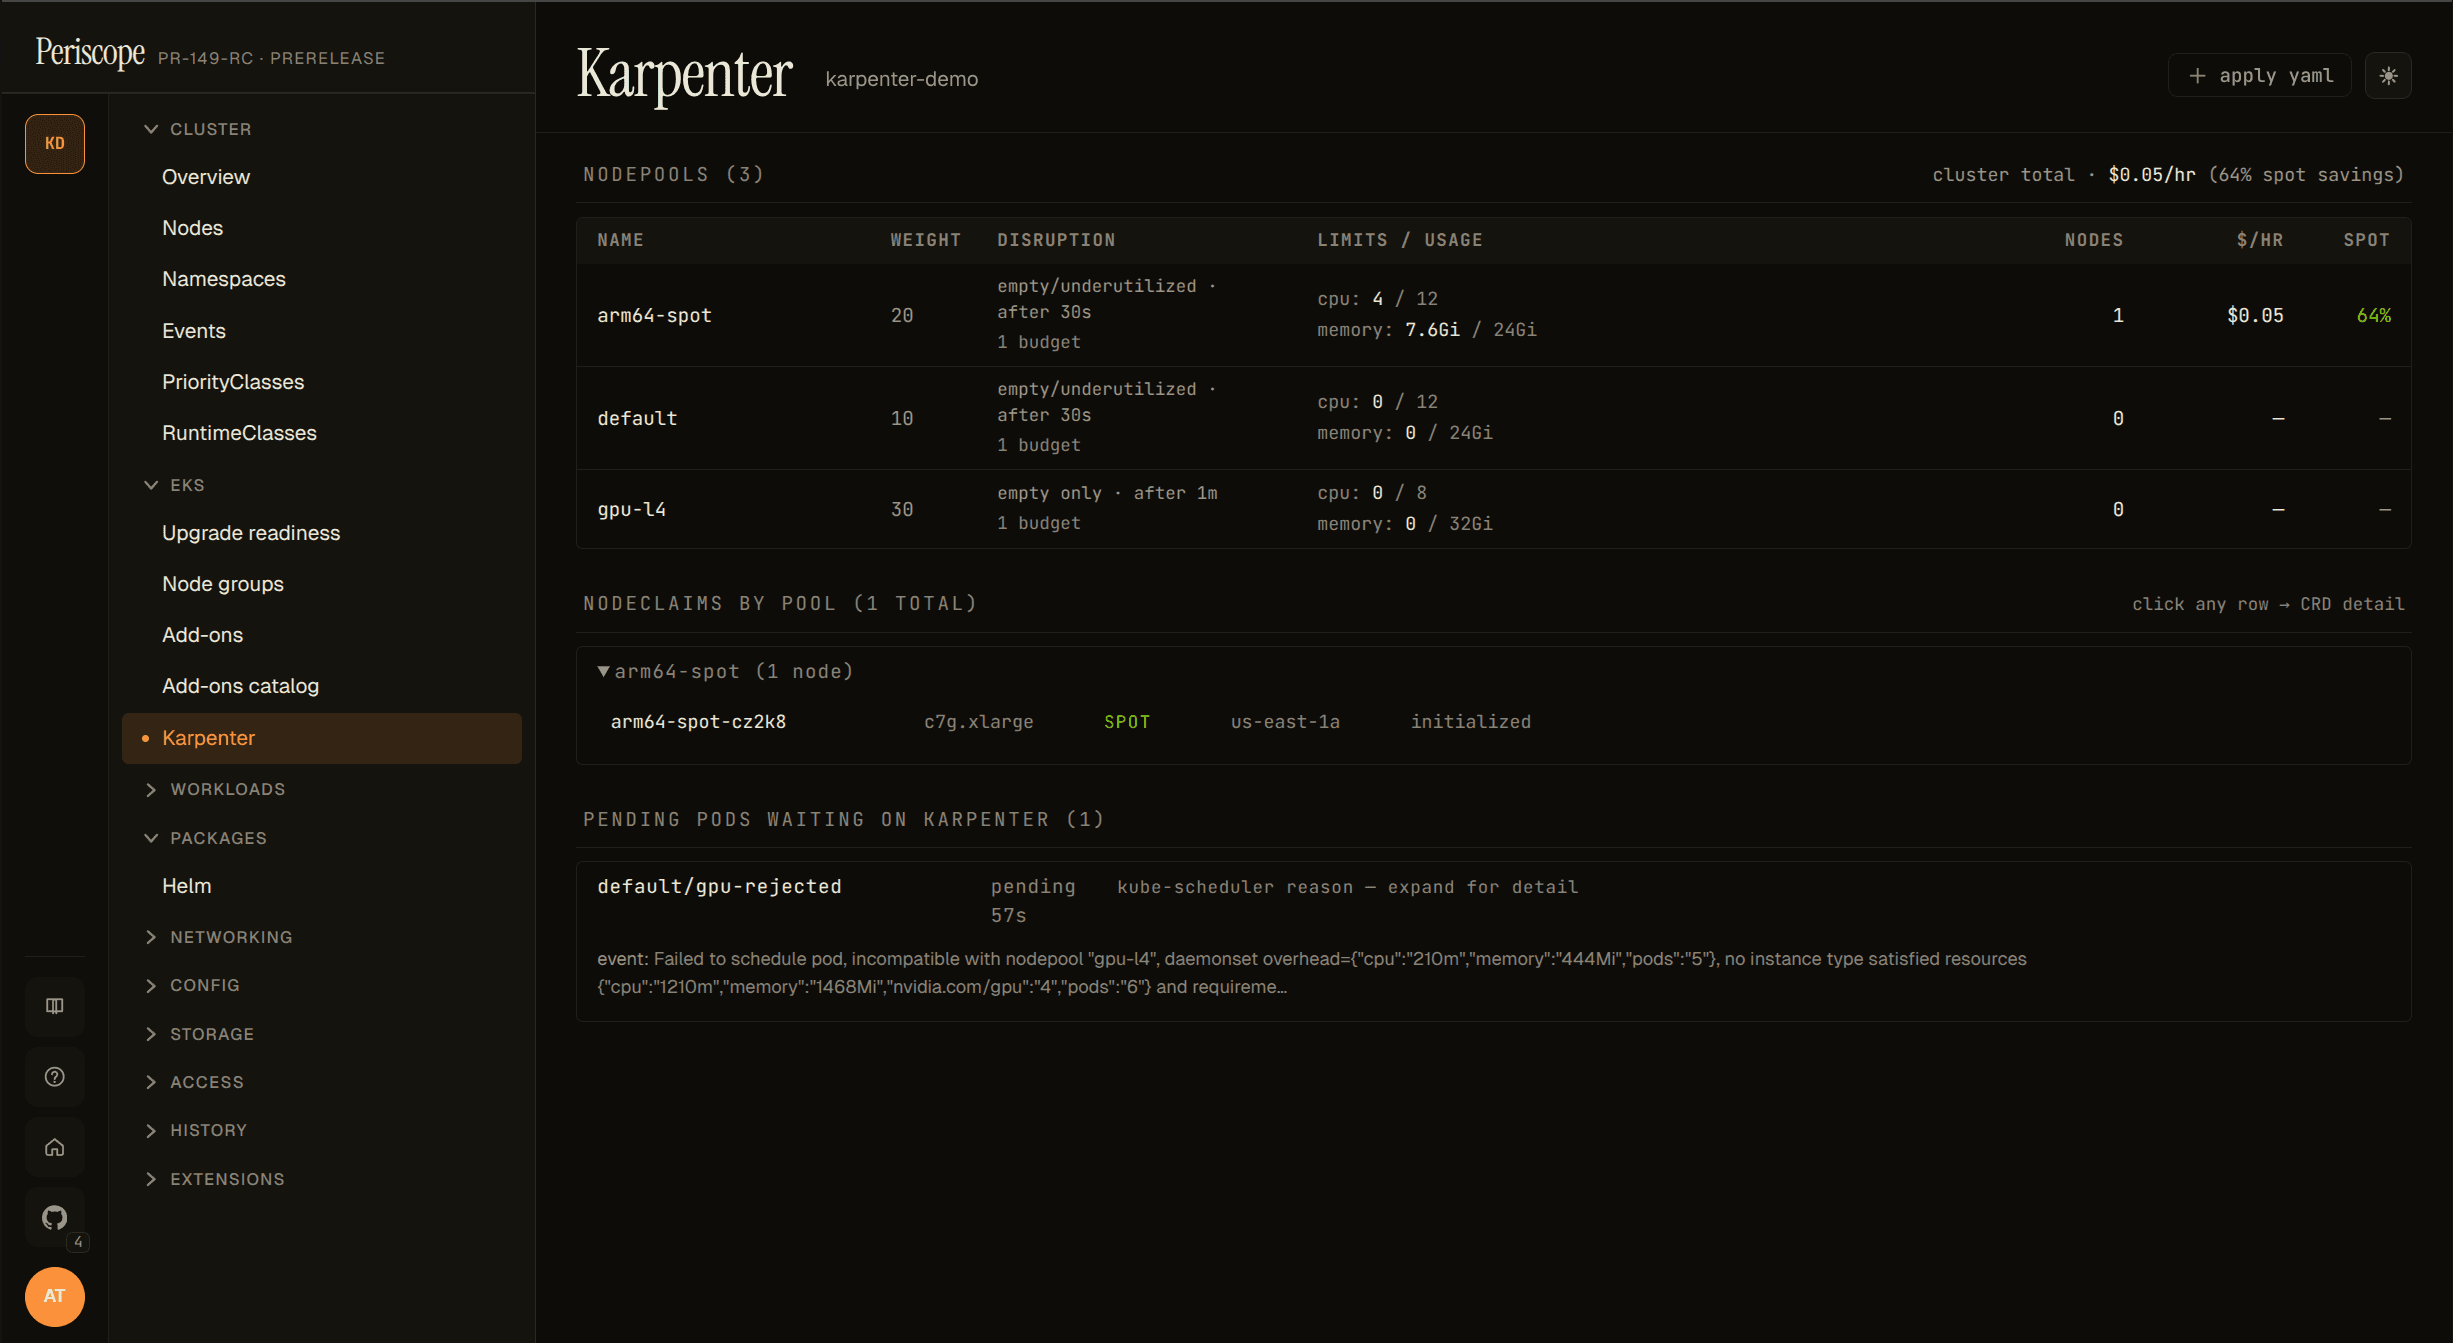
The breakdown is parsed out of the Reason="FailedScheduling" Event
that Karpenter publishes for each unschedulable pod. The Event has a
5-minute deduplication window, so very recently-failed pods may
briefly show the raw event text instead of the parsed breakdown
(re-render after a few seconds usually fills it in). Pods that
haven't yet had their first FailedScheduling event surface as
"no scheduling event found yet" — give it a few seconds.
The list is capped at 50 pods (sorted oldest-pending-first); a
showing first 50 of N hint appears when more exist. Bursting
clusters with hundreds of pending pods should drill into specific
namespaces via kubectl describe pod for the full list — the
dashboard is for triage, not for batch reporting.
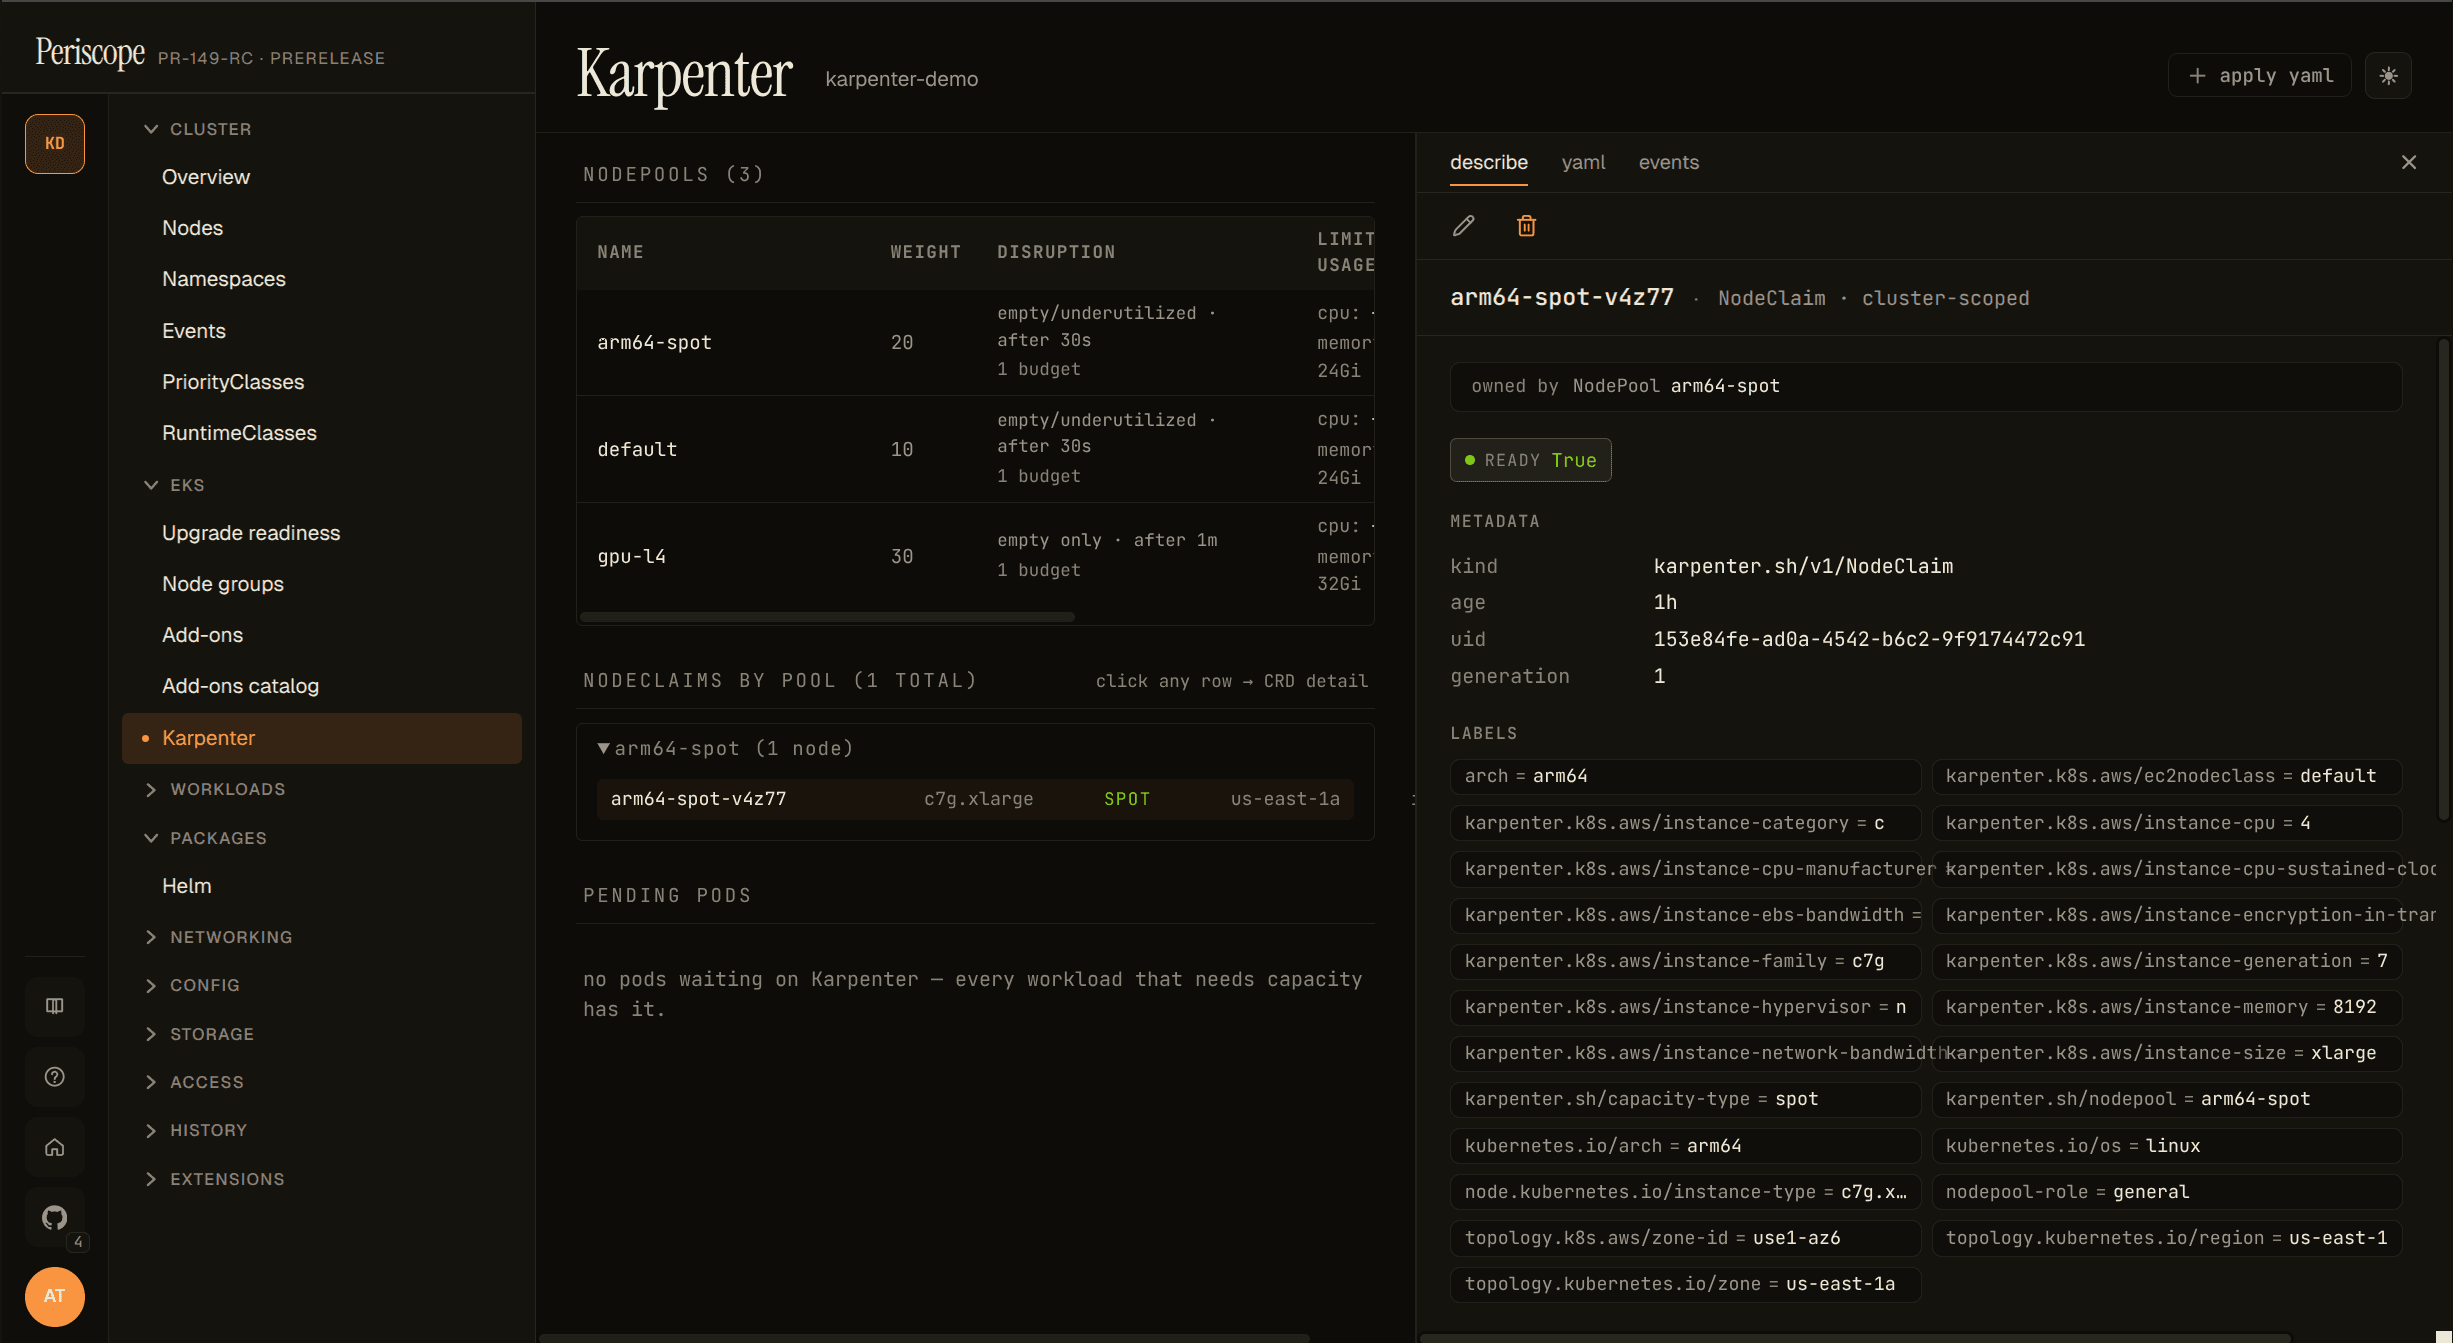
NodeClaim grouping
NodeClaims are grouped by their karpenter.sh/nodepool label and
collapsed by default — pools with at least one drifted node auto-open
so the drift signal is visible without a click.
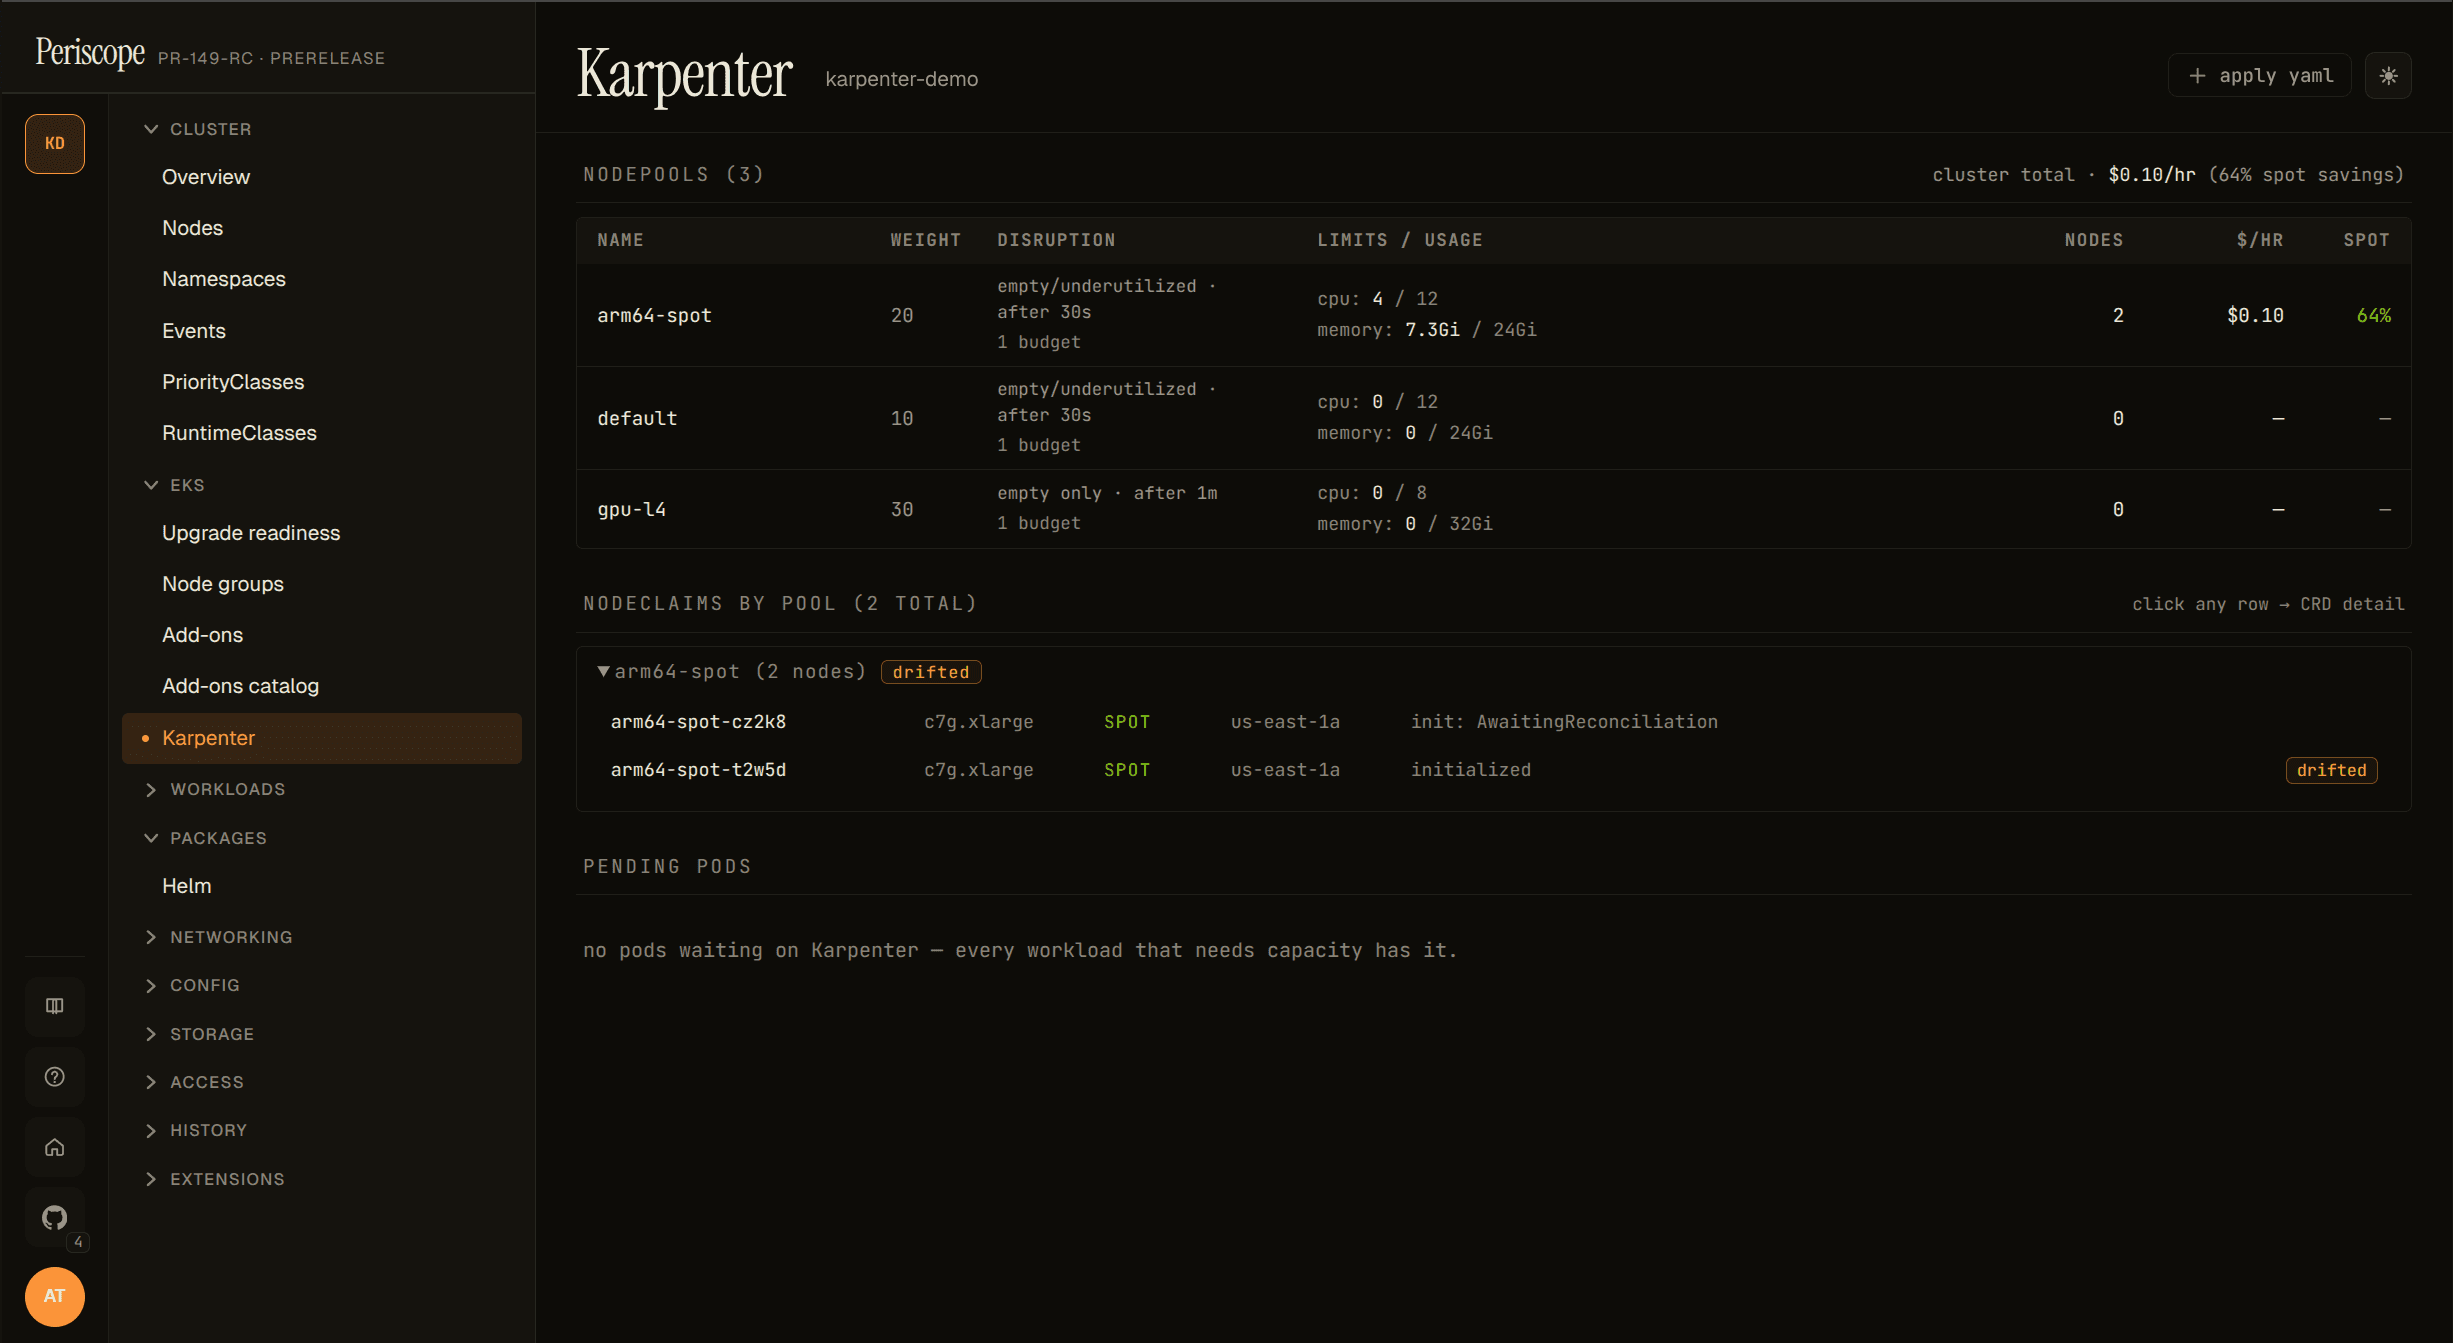
The Drifted=True condition is the v1 operator signal that a node
was provisioned against a NodePool / EC2NodeClass that has since
changed (image bump, taint added, etc.). On a single drifted node
this means "consolidate / replace this one"; on dozens-of-drifted
across a pool it's typically the result of an EKS upgrade or AMI
refresh in progress.
Each row click opens the inline detail pane (describe / yaml / events) on the right — same pane as the NodePool table, scoped to the selected NodeClaim. No separate detail page exists in the dashboard.
What's not in v1.1 (tracked for future)
- Disruption-blocked-by badge — see #148.
- EC2NodeClass detail with AMI rollout progress — see #148.
- ICE (InsufficientInstanceCapacity) blacklist panel — see #148.
- Consolidation event timeline — bigger feature, no current issue.
- Karpenter CRD edits — the page is read-only by design. Operators edit NodePools via their GitOps pipeline.
Audit
Every page load emits one karpenter_read audit row regardless of
outcome, with an op extra distinguishing available_false /
list / *_failed paths. See RFC 0003 4 for the full taxonomy.