docsusagecve
CVE dashboard for EKS pods — Amazon Inspector v2 integration
Per-pod, per-workload, per-node, per-NodeClaim CVE counts inline in Periscope, plus a drill-down Security tab with package groupings and per-package upgrade targets. Data sourced from Amazon Inspector v2.
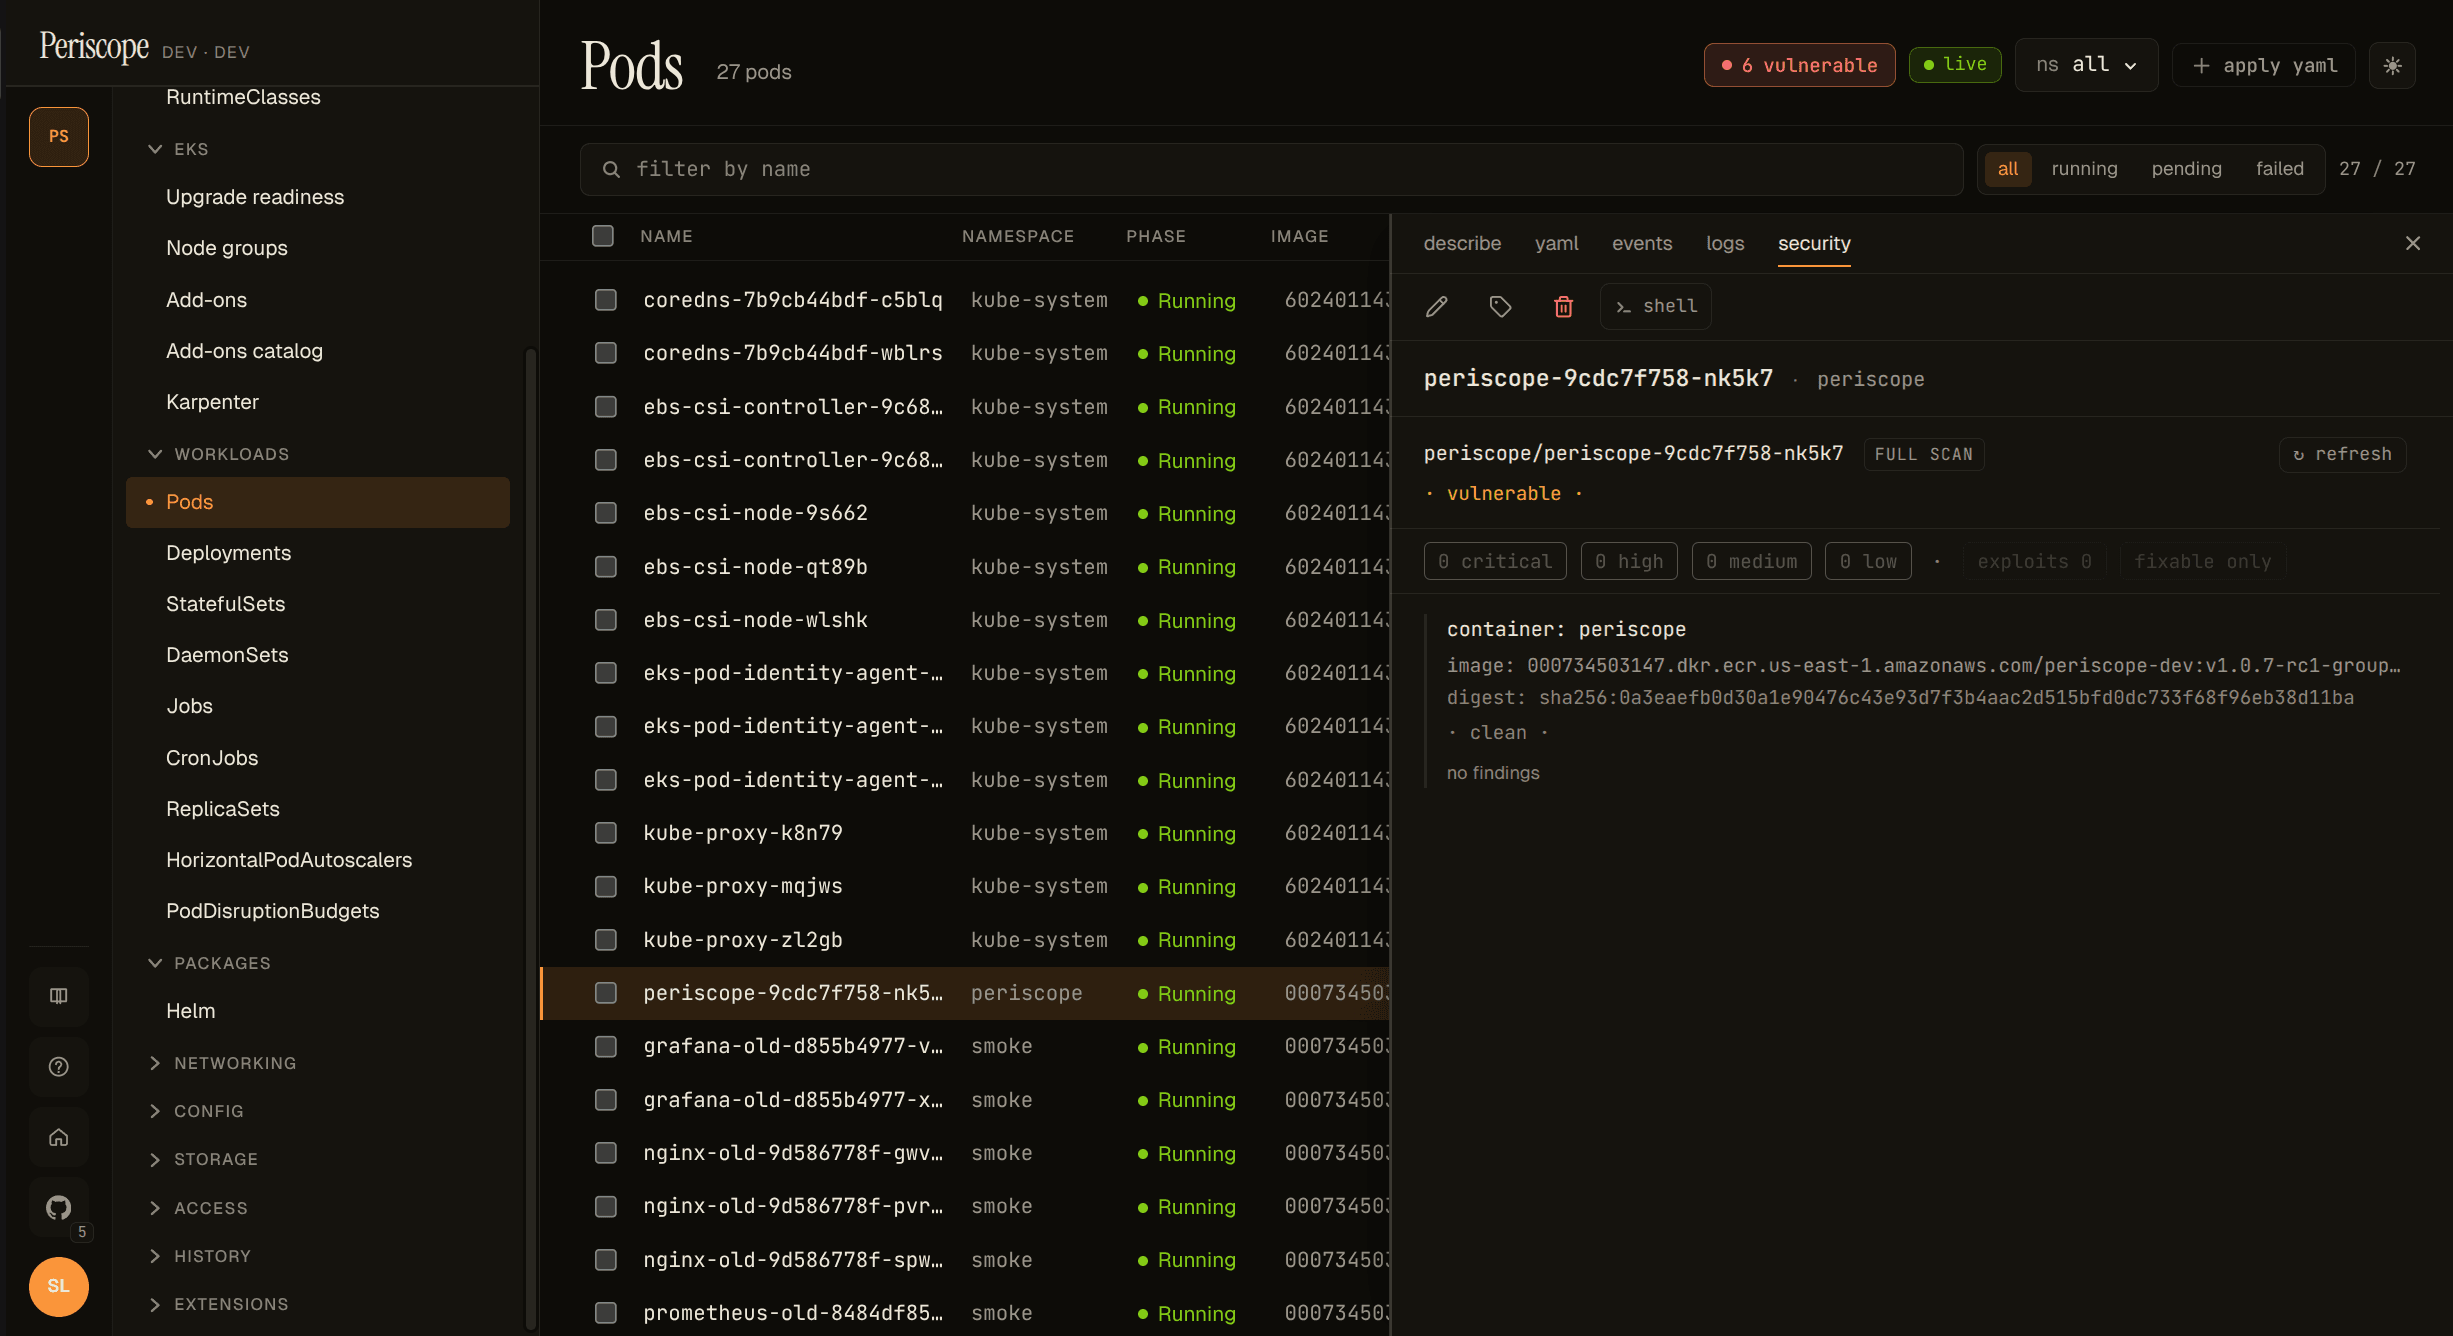
Periscope shows per-pod, per-workload, per-node, and per-NodeClaim CVE counts inline on the Pods / Nodes / Workloads / Karpenter pages, with a drill-down Security detail-pane tab that groups raw Inspector findings by package, sorts them by triage priority, and surfaces the per-package upgrade target. Data comes from Amazon Inspector v2 via a per-cluster local cache the periscope-server hydrates on first request.
Enable Inspector v2
CVE data is opt-in. Operators have to (1) turn on Inspector v2 in
the AWS account, (2) grant the periscope-server's Pod Identity /
IRSA role the inspector2:* + ec2:Describe* permissions, and (3)
flip the Helm value:
inspector:
  enabled: true
Full IAM block (and the rationale for each permission) is in
cluster-rbac.md.
The first request after inspector.enabled: true blocks ~10-30s
while Periscope hydrates the per-cluster cache from Inspector;
subsequent reads are served from memory at single-digit-ms latency.
Inspector-disabled empty state. When inspector.enabled: false
(the default) or the IAM grant is missing, every CVE-aware page
shows a once-per-cluster hairline banner — "Inspector v2 is not
enabled on this cluster — vulnerability data is unavailable" —
with a link back to this guide. The vulnerabilities columns render
not scanned. Periscope never errors out; the empty-state contract
is the standard "no data" path. Dismiss is cluster-scoped via
localStorage, so dismissing on one CVE-aware page also dismisses on
the others.
Read the row chip
The list-row chip uses a compact form: 2C · 5H · 12M. Each letter
is the bucket: C critical, H high, M medium. Low and
informational are dropped from the inline view; hover the chip for
the full breakdown plus the last-scanned timestamp.
Chip states:
| State | What it means |
|---|---|
2C · 5H · 12M | Entity has findings of those severities. |
· clean · | Scanned, zero findings. |
partial | Some containers scanned, at least one not (mixed pod, see below). |
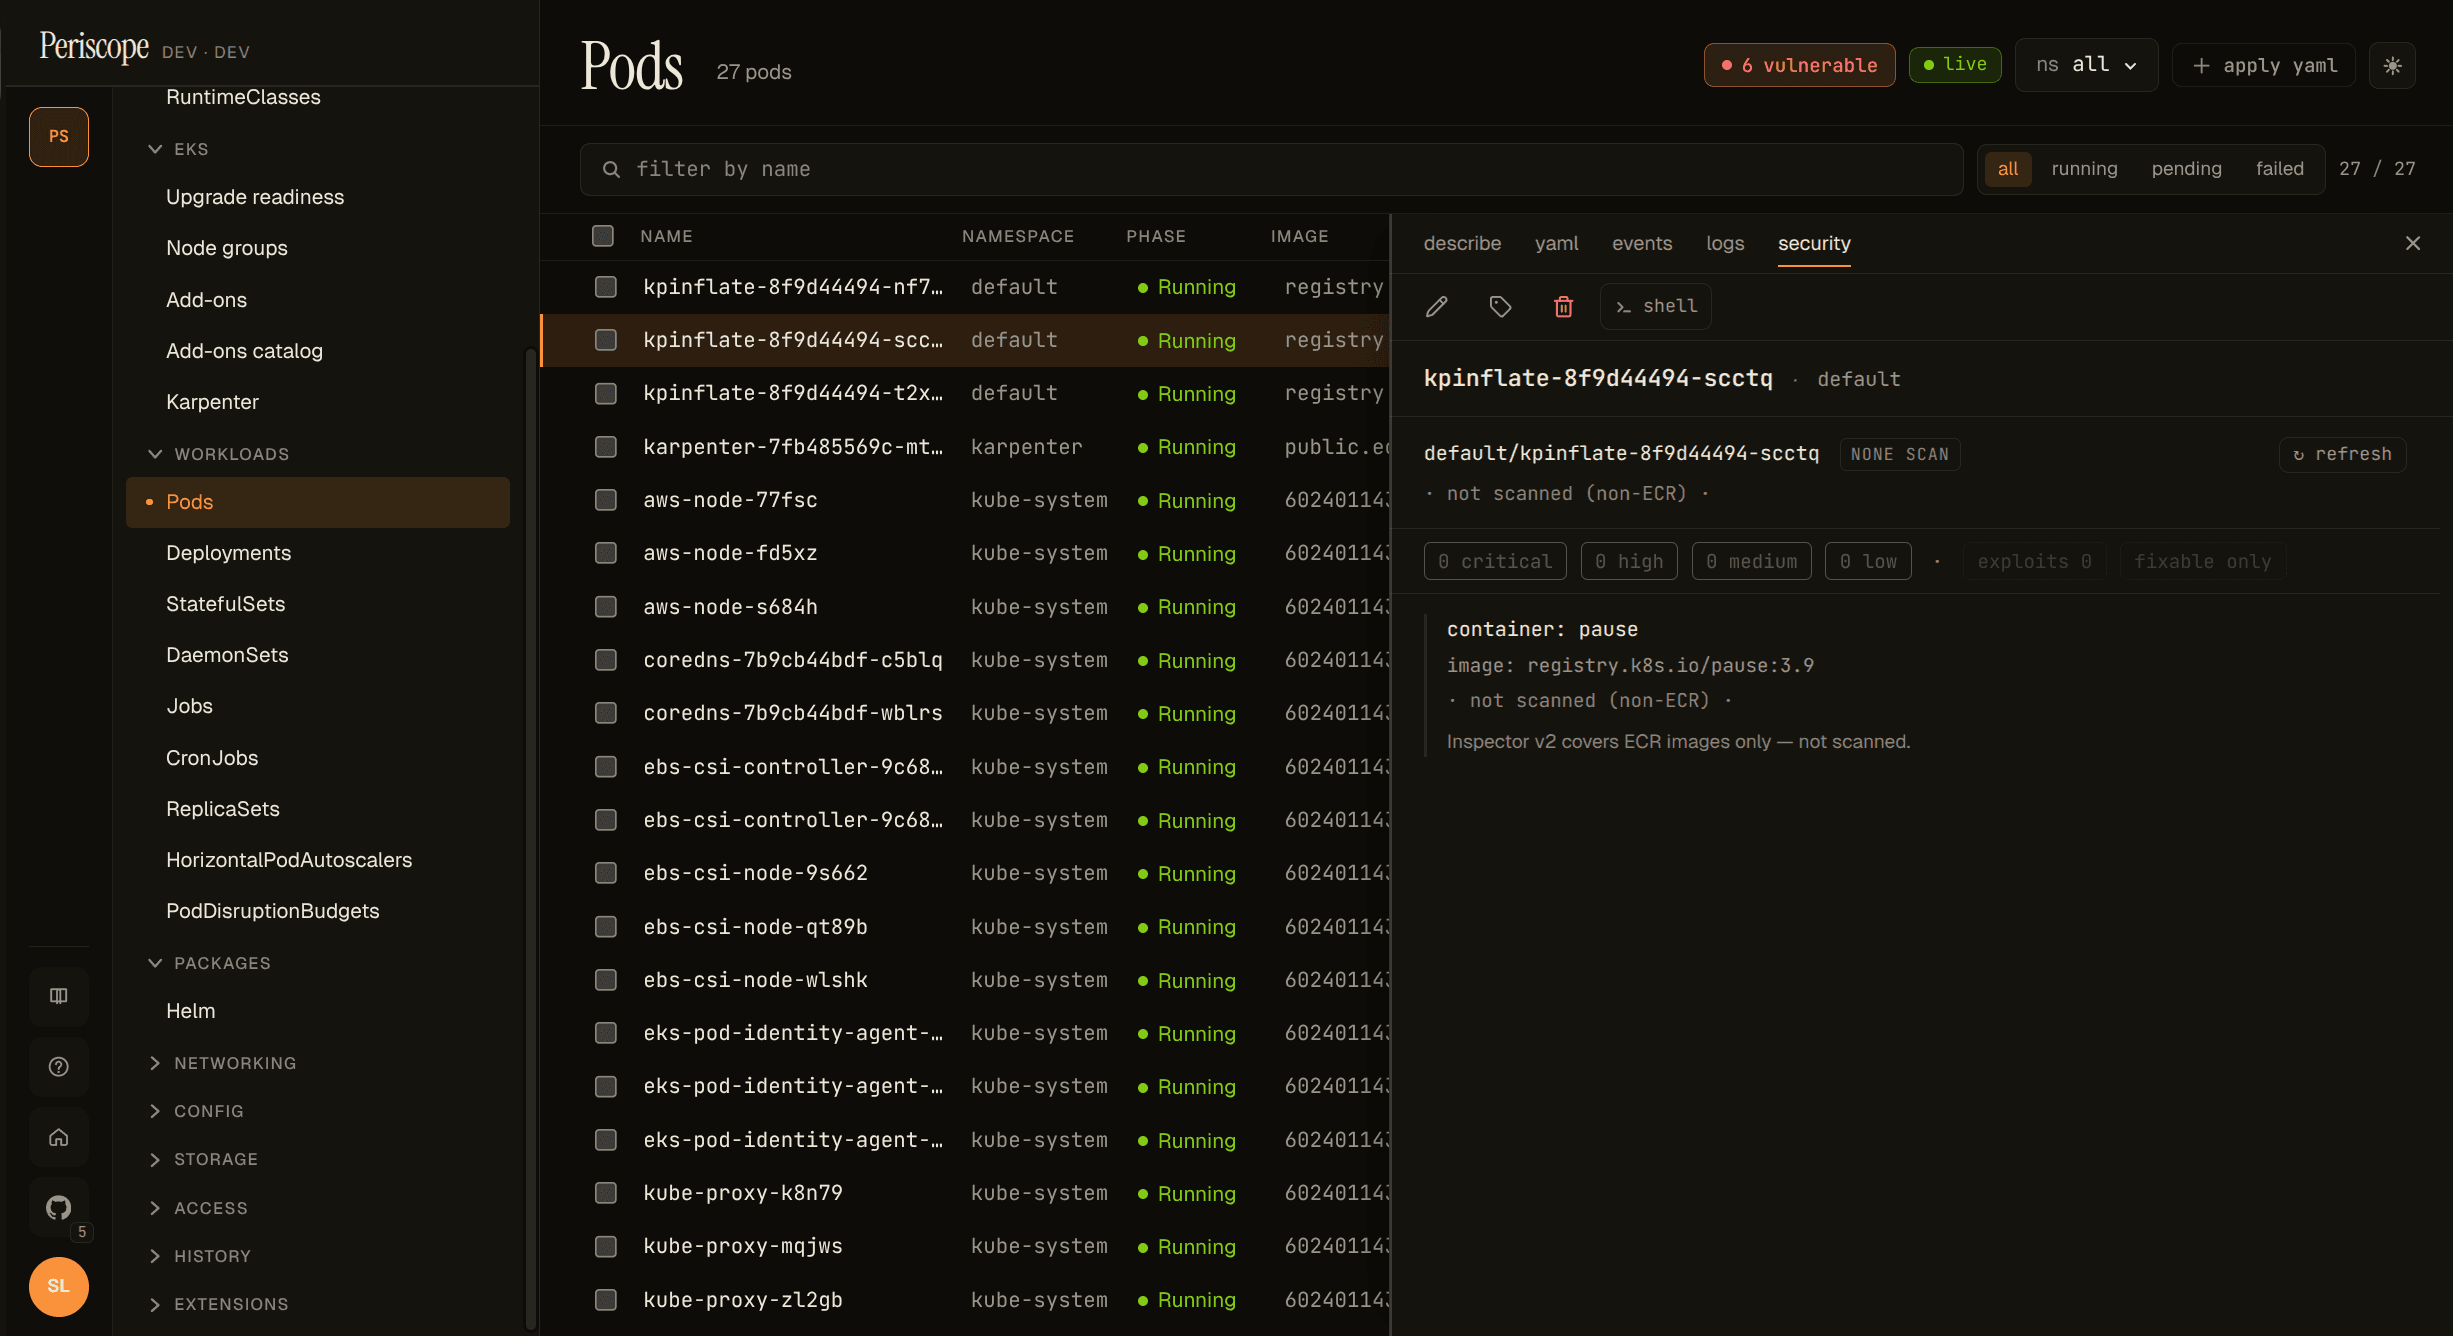
non-ECR | Image is not in ECR. Inspector v2 doesn't cover non-ECR images. |
pending | ECR image, but the pod hasn't pulled it yet (no digest available). |
unscanned | The cache hasn't covered this entity yet, or inspector is disabled. |
The chip column lights up across Pods, Nodes, and Karpenter:
The Deployments page renders a per-Deployment Security tab but does
not yet carry a chip column (the SPA's DeploymentSummary doesn't
carry the replica pod list, so populating a row chip would need
either N parallel /cve/by-workload fetches per visible row or a
new server-side aggregation index — tracked as a follow-up).
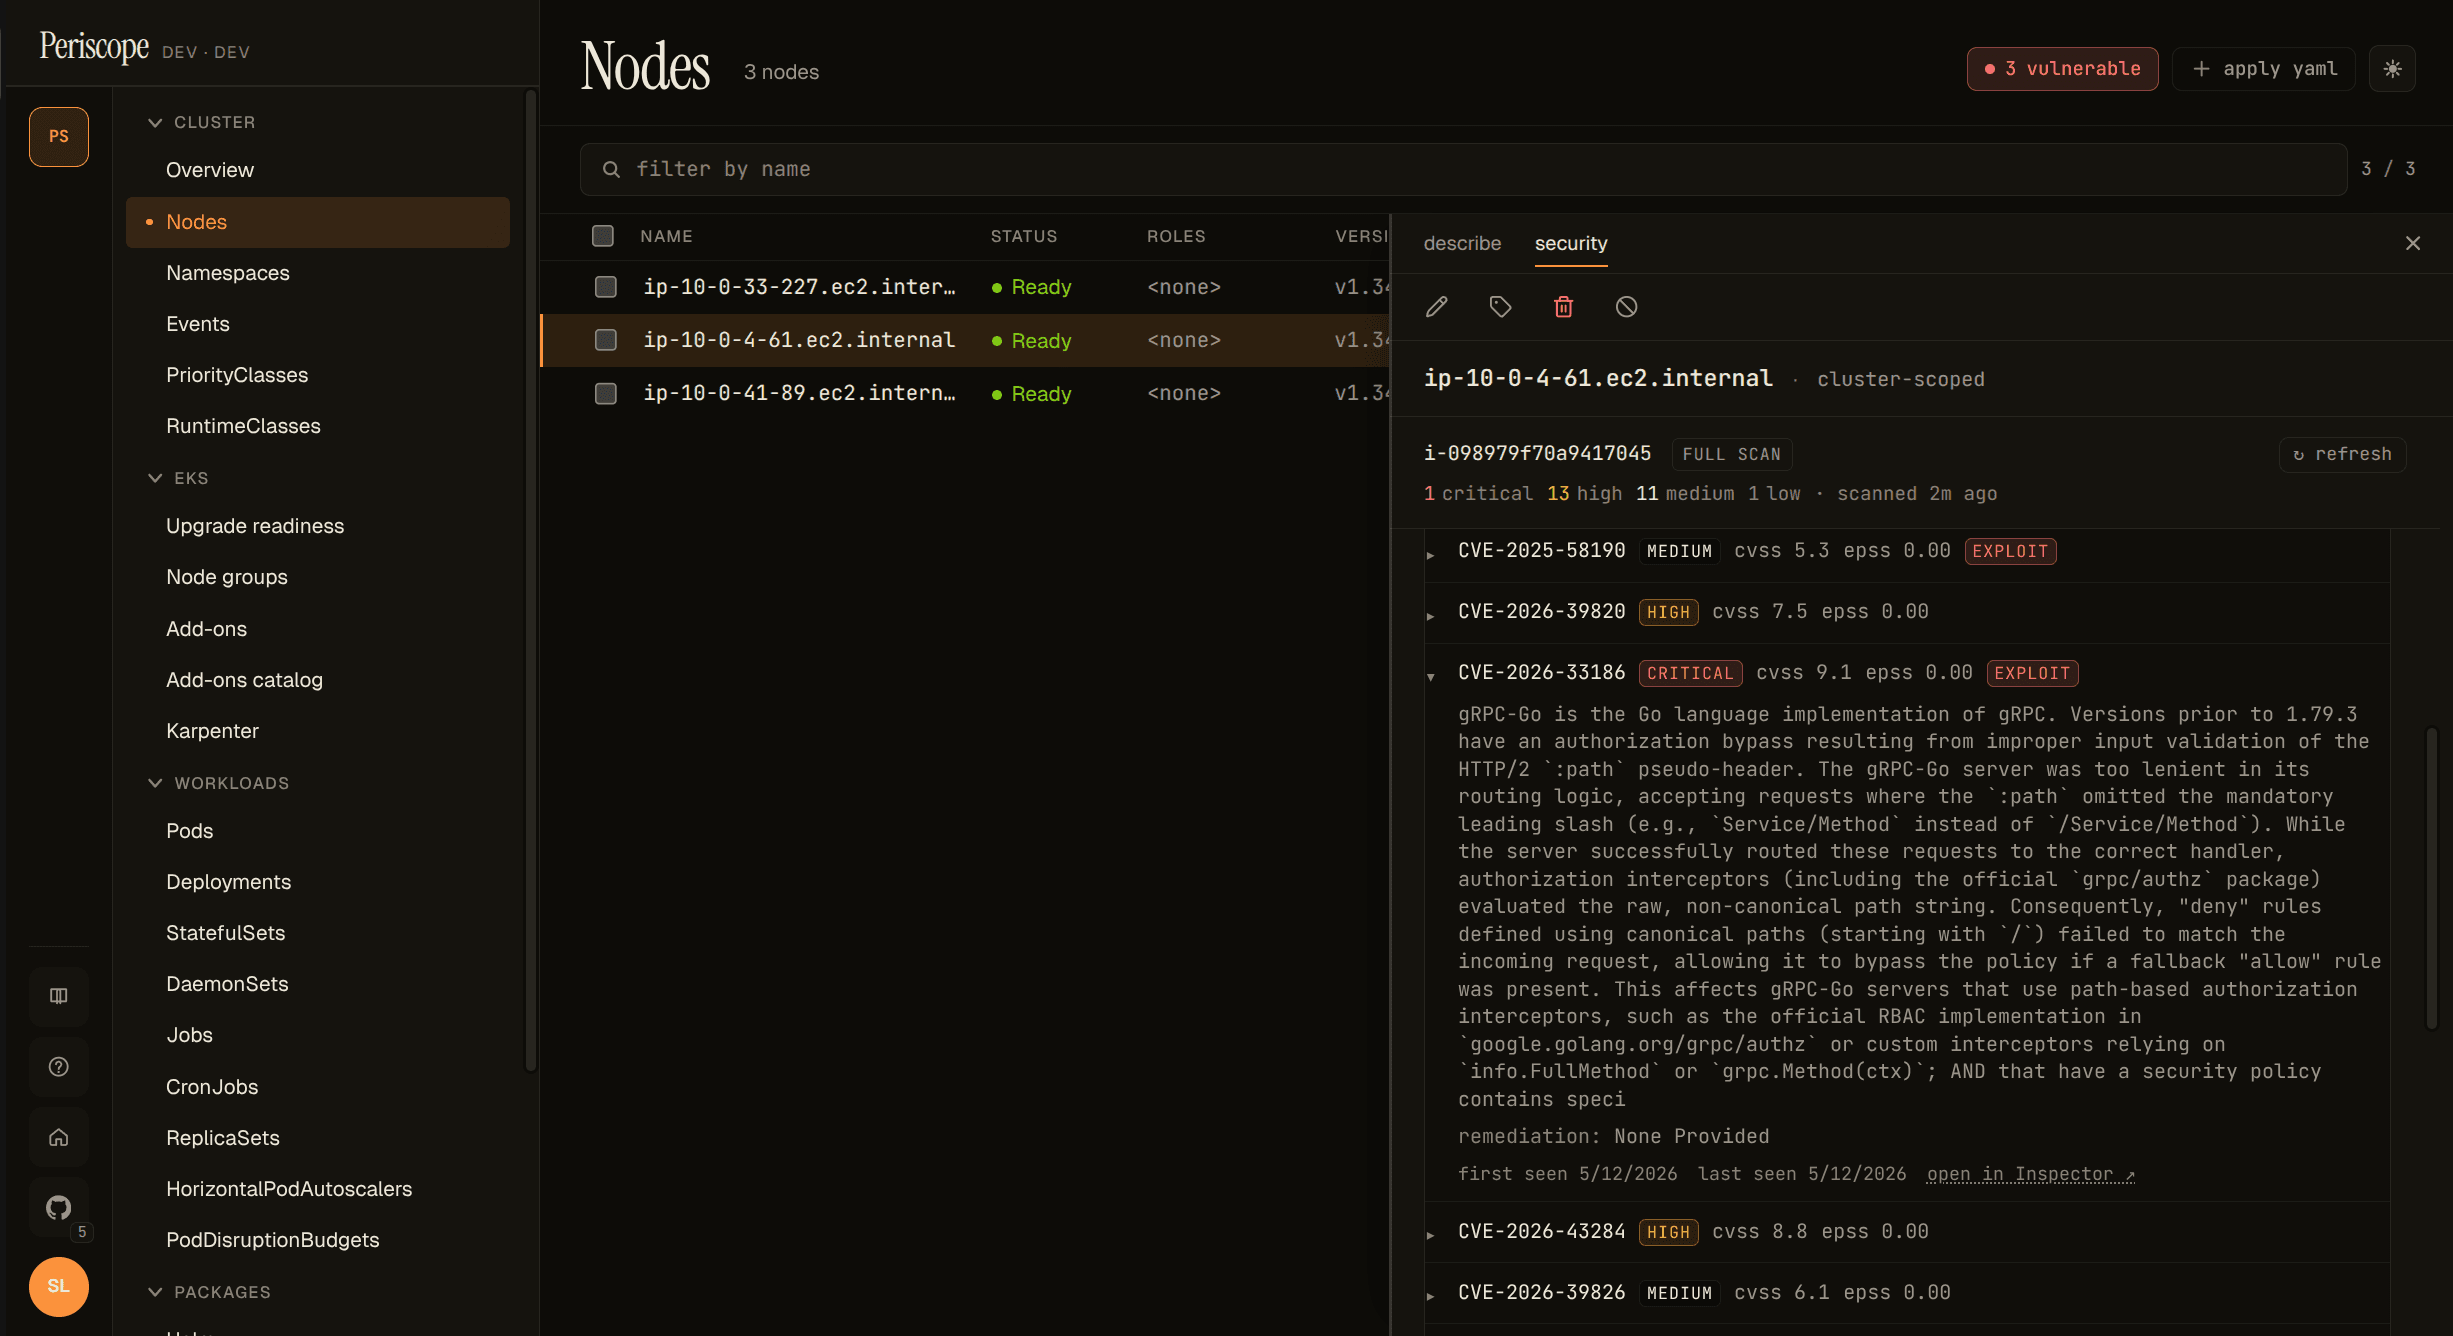
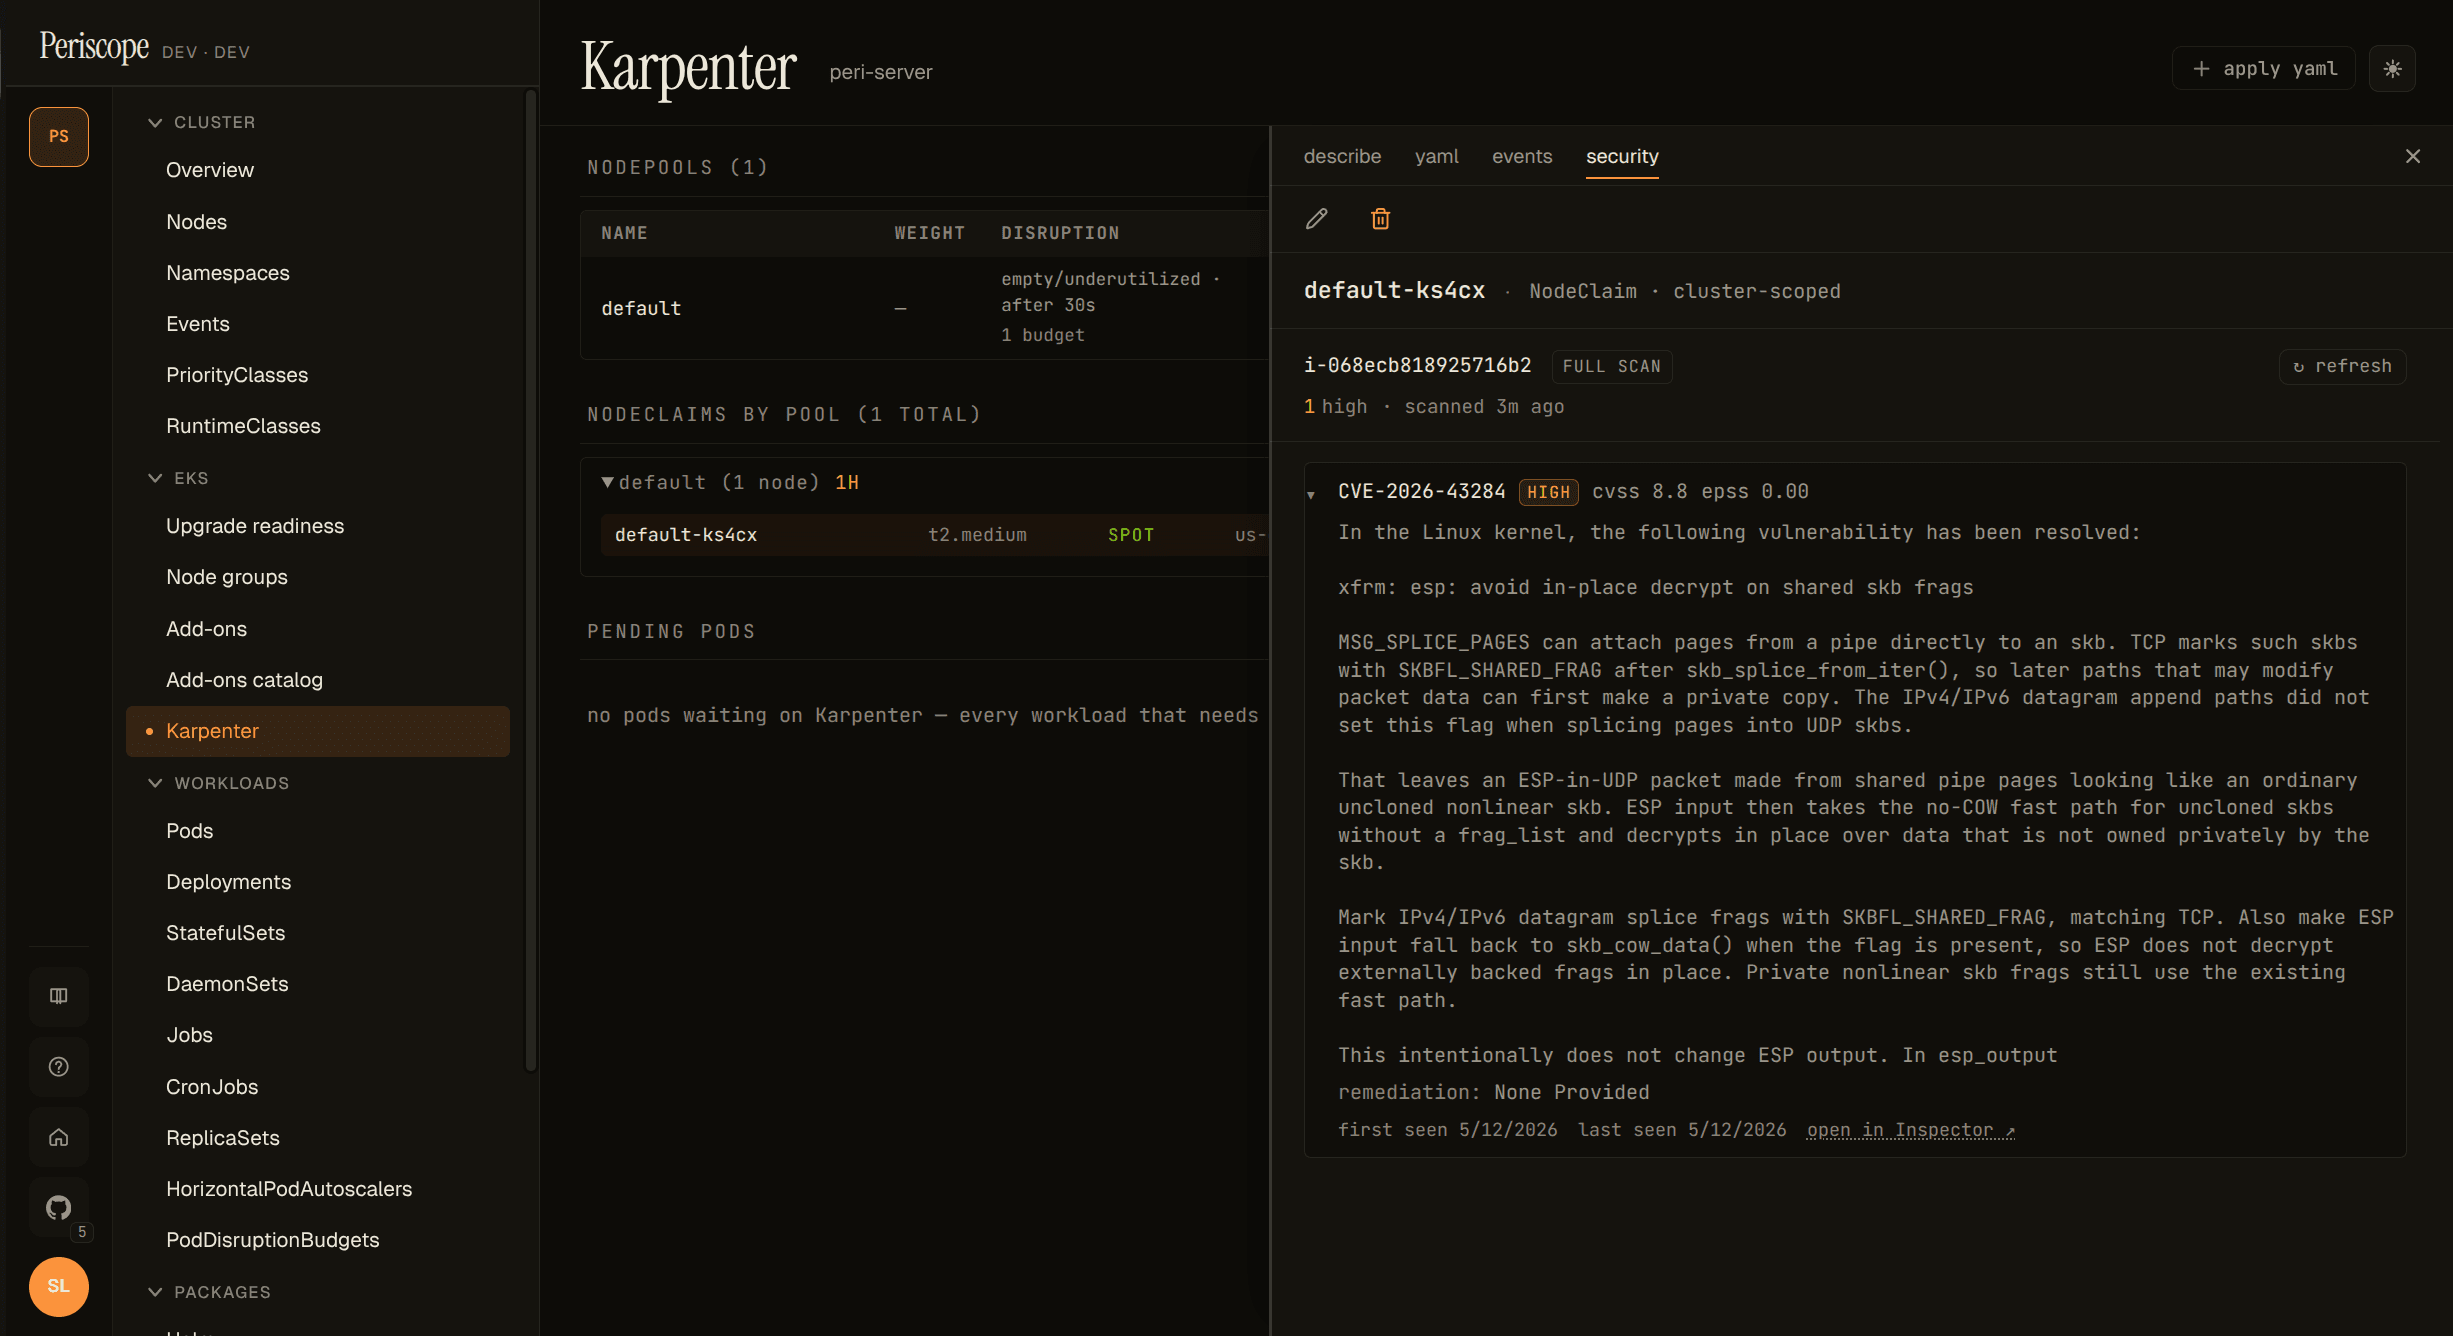
Read the Security tab
Open any pod, node, deployment / statefulset / daemonset, or
Karpenter NodeClaim detail pane — the new security tab sits next
to describe / yaml / events / logs. A small red dot on the tab
label means the entity has at least one critical finding; amber
means at least one high. Silence is the signal — no dot means no
critical or high findings.
The tab content has three shapes:
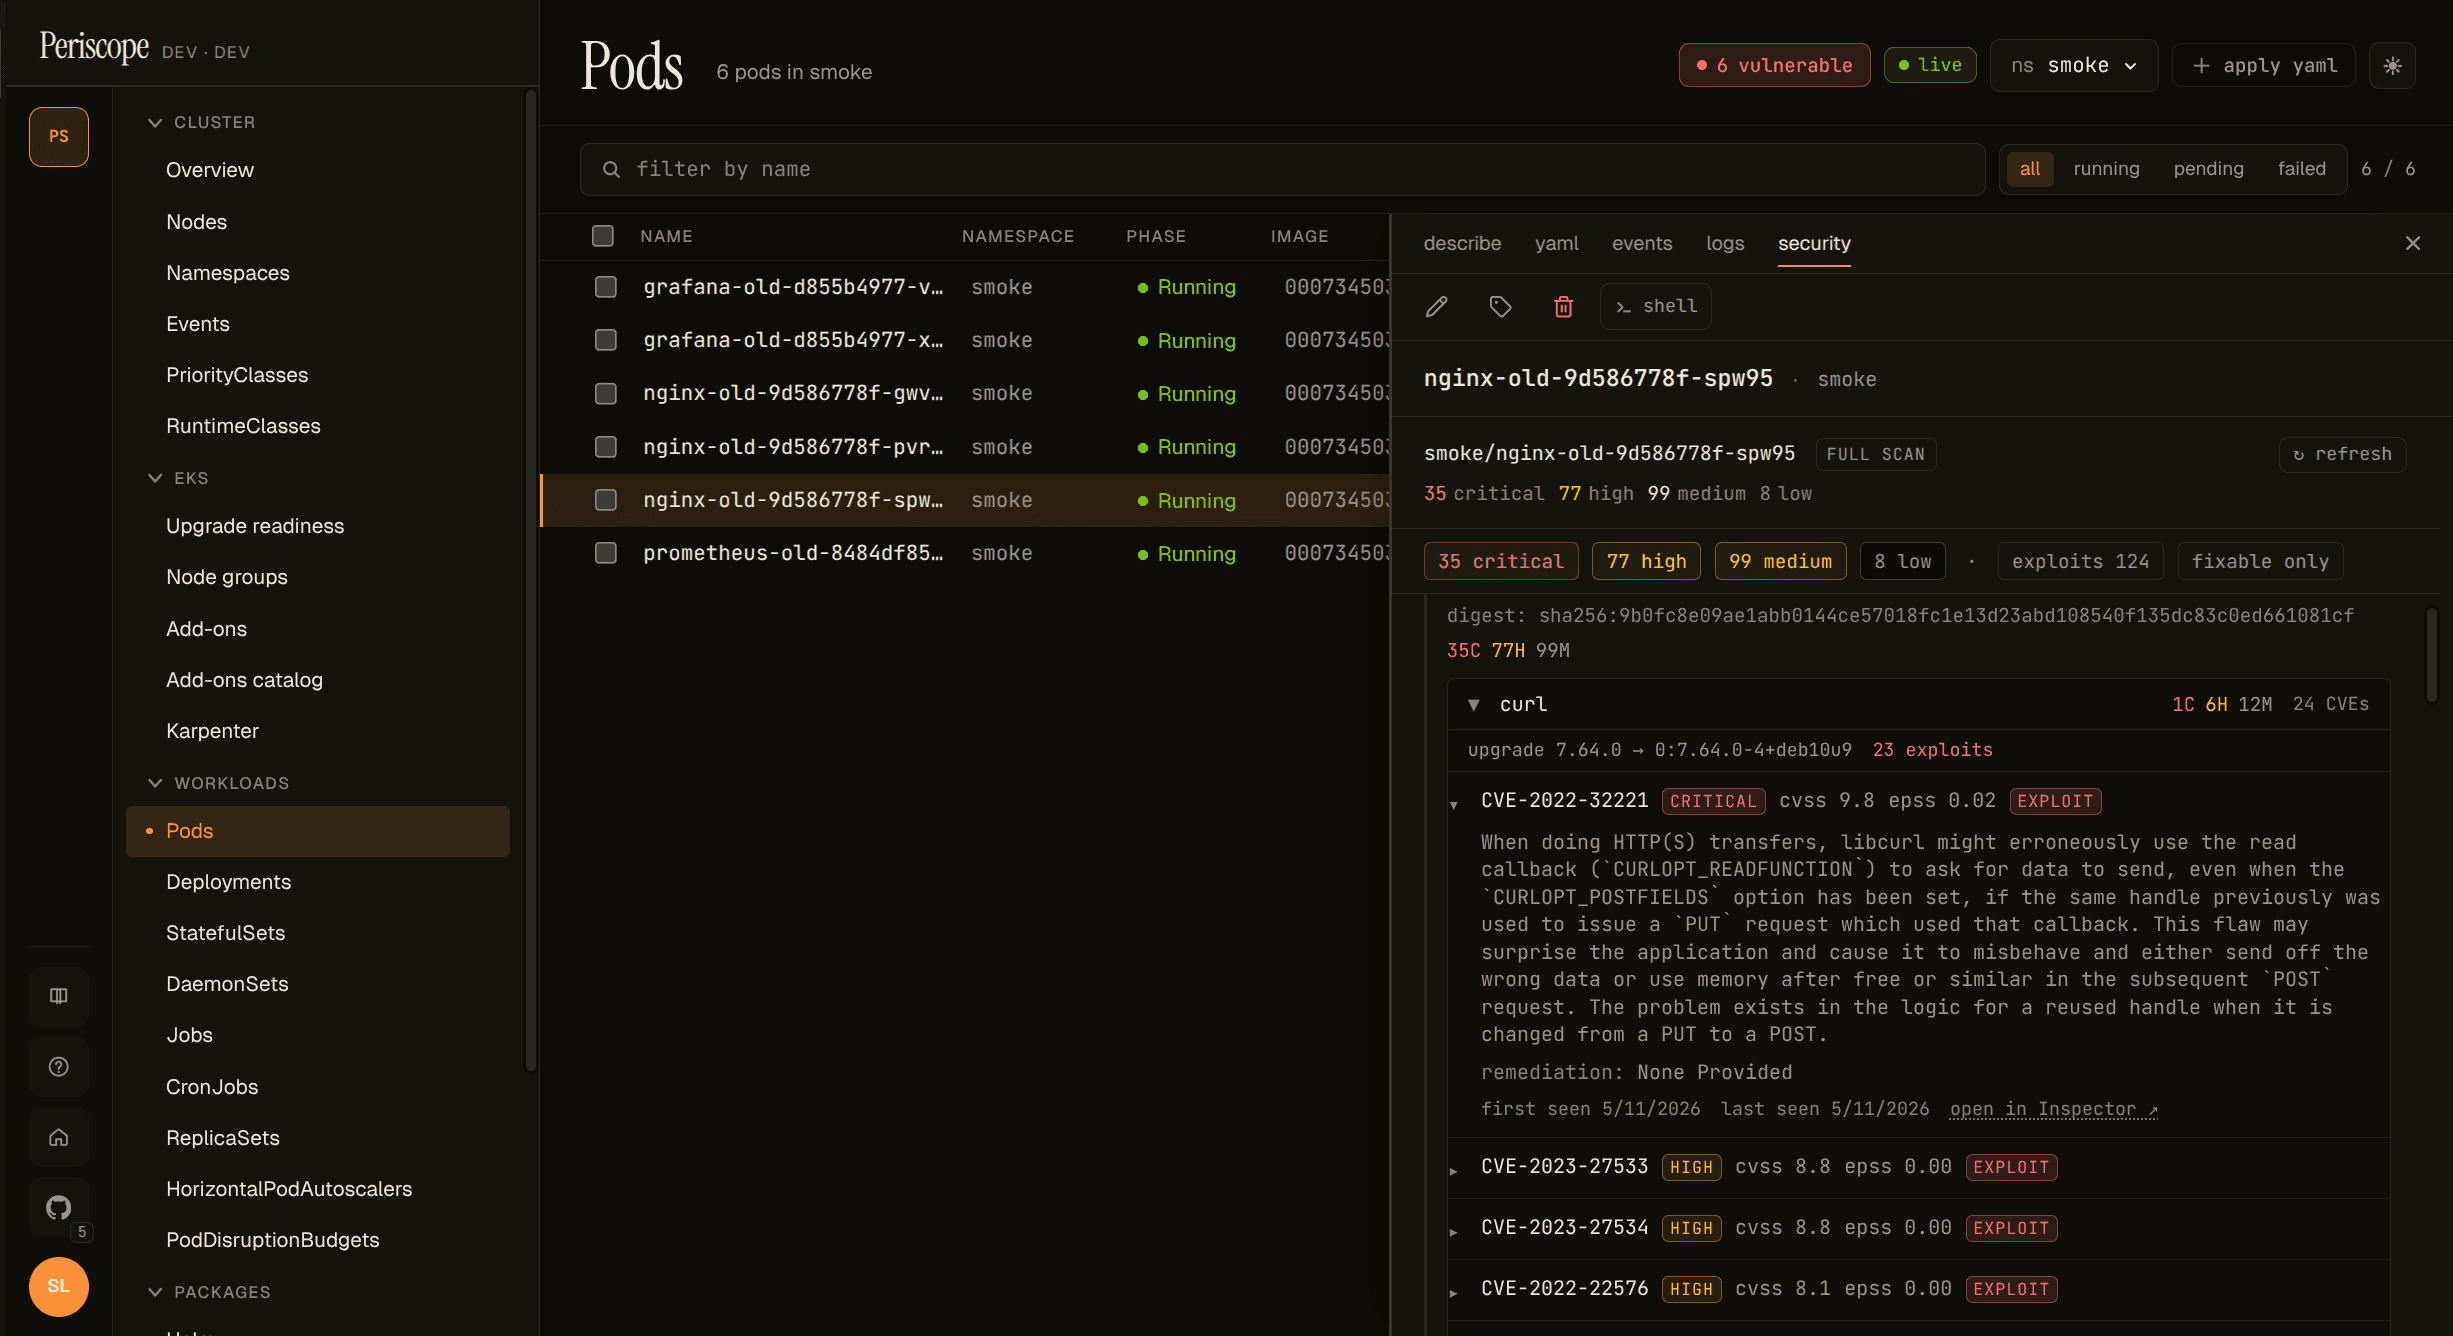
- Pod: per-container groups, each rendered as a header (image, digest, scan state, chip) plus a package-grouped finding list.
- Node / NodeClaim: flat finding list against the EC2 instance, with the instance ID and owner badge at the top. No package grouping yet — Inspector's EC2 findings are kernel-level + AMI package-level and don't share the same "bump the package" pattern the container side does.
- Deployment / StatefulSet / DaemonSet: unique containers
deduped across replicas (
× N podsannotation) plus a per-pod replica chip list at the bottom — click a replica to jump straight to that pod's Security tab.
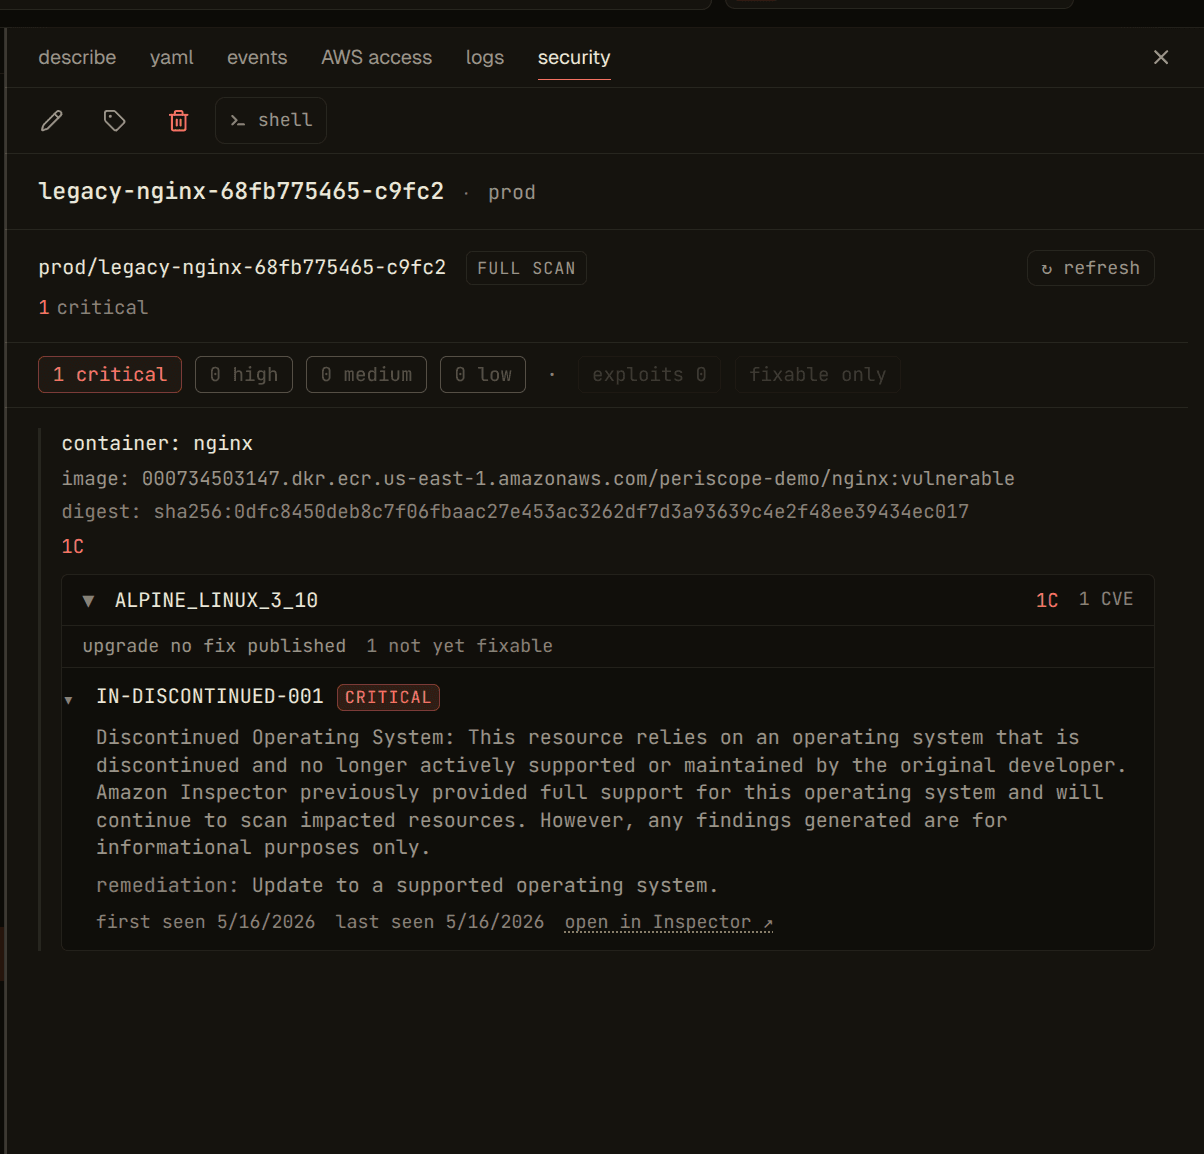
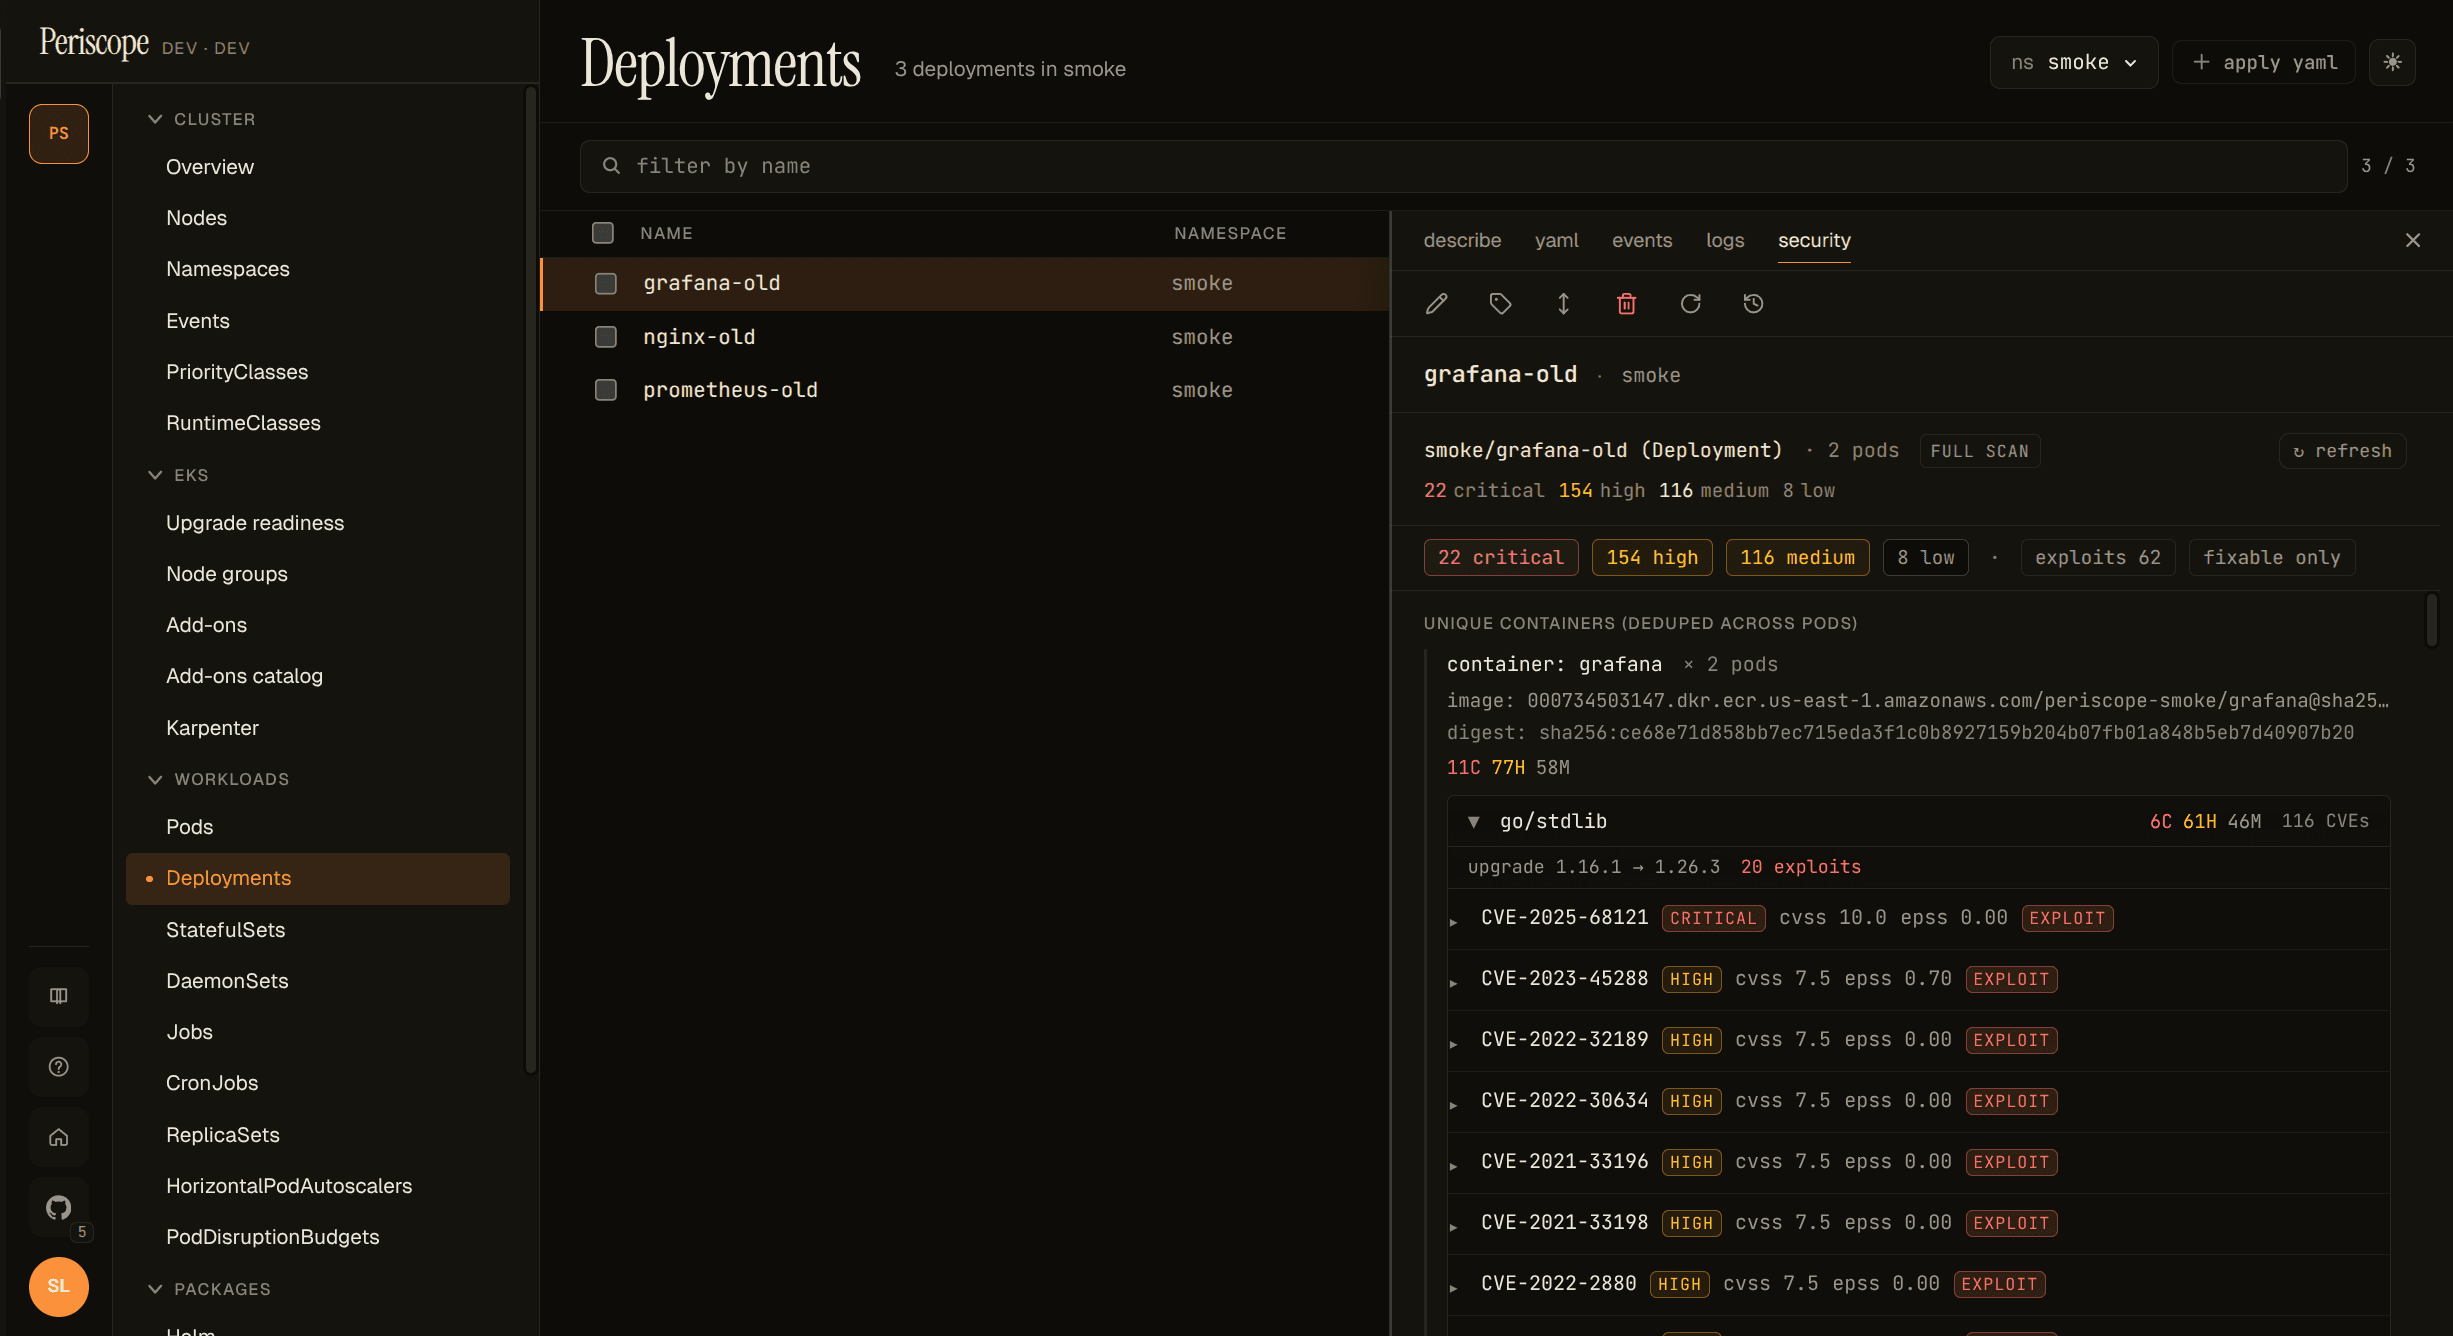
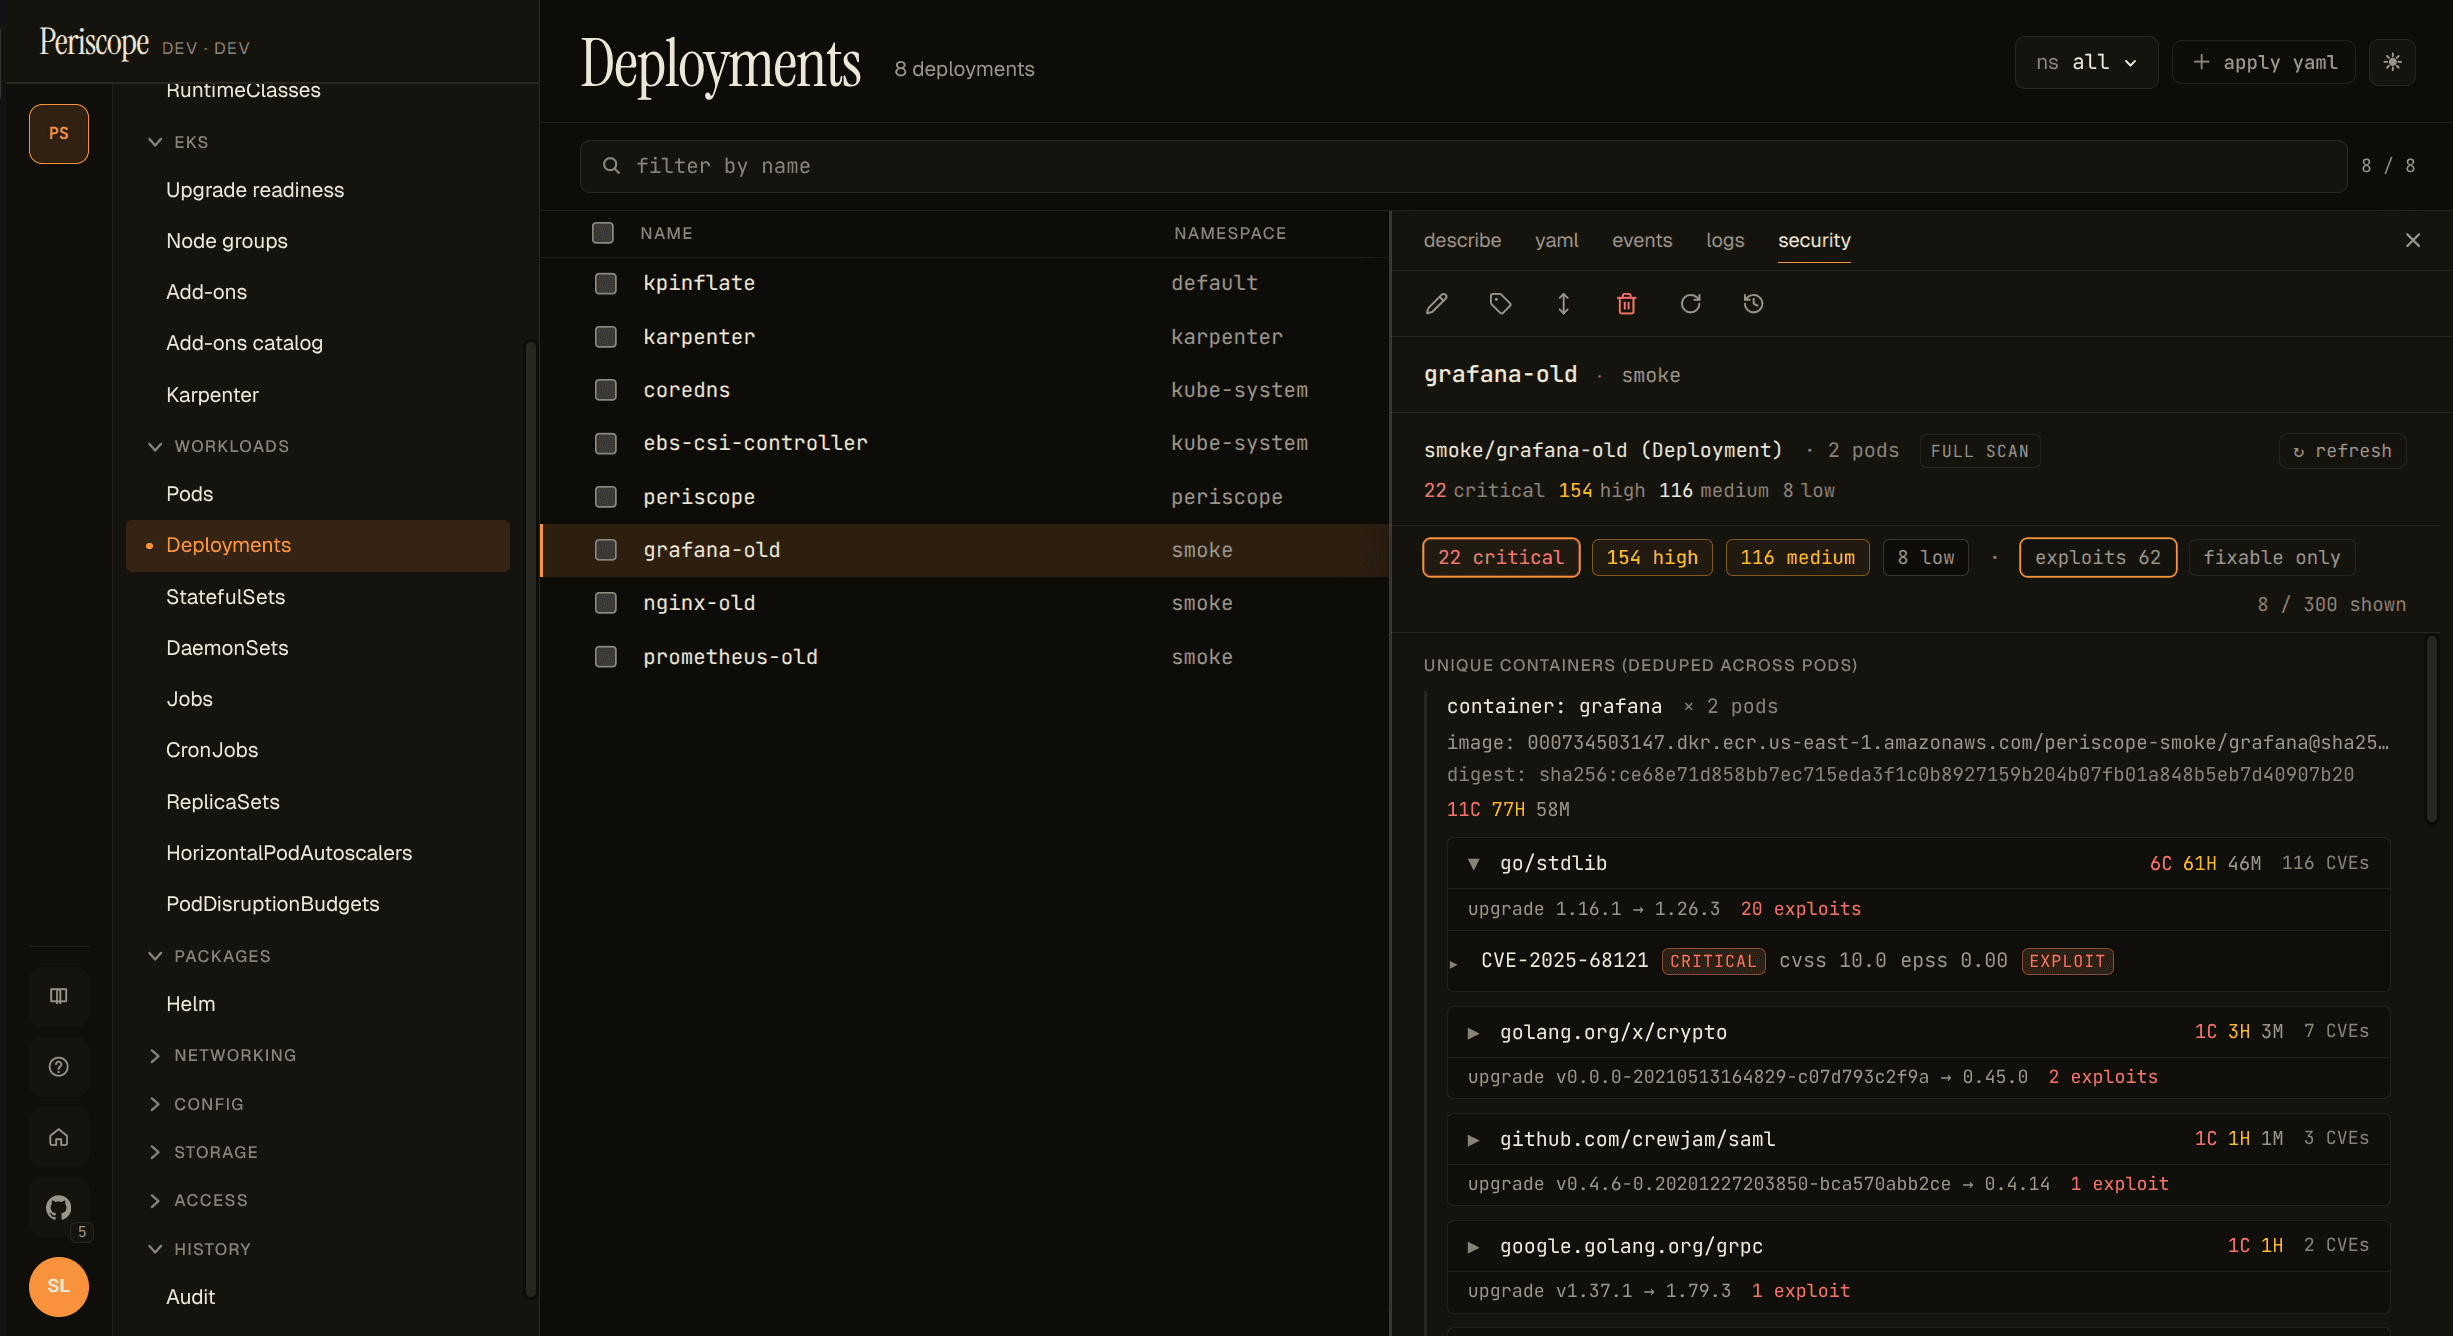
Package grouping
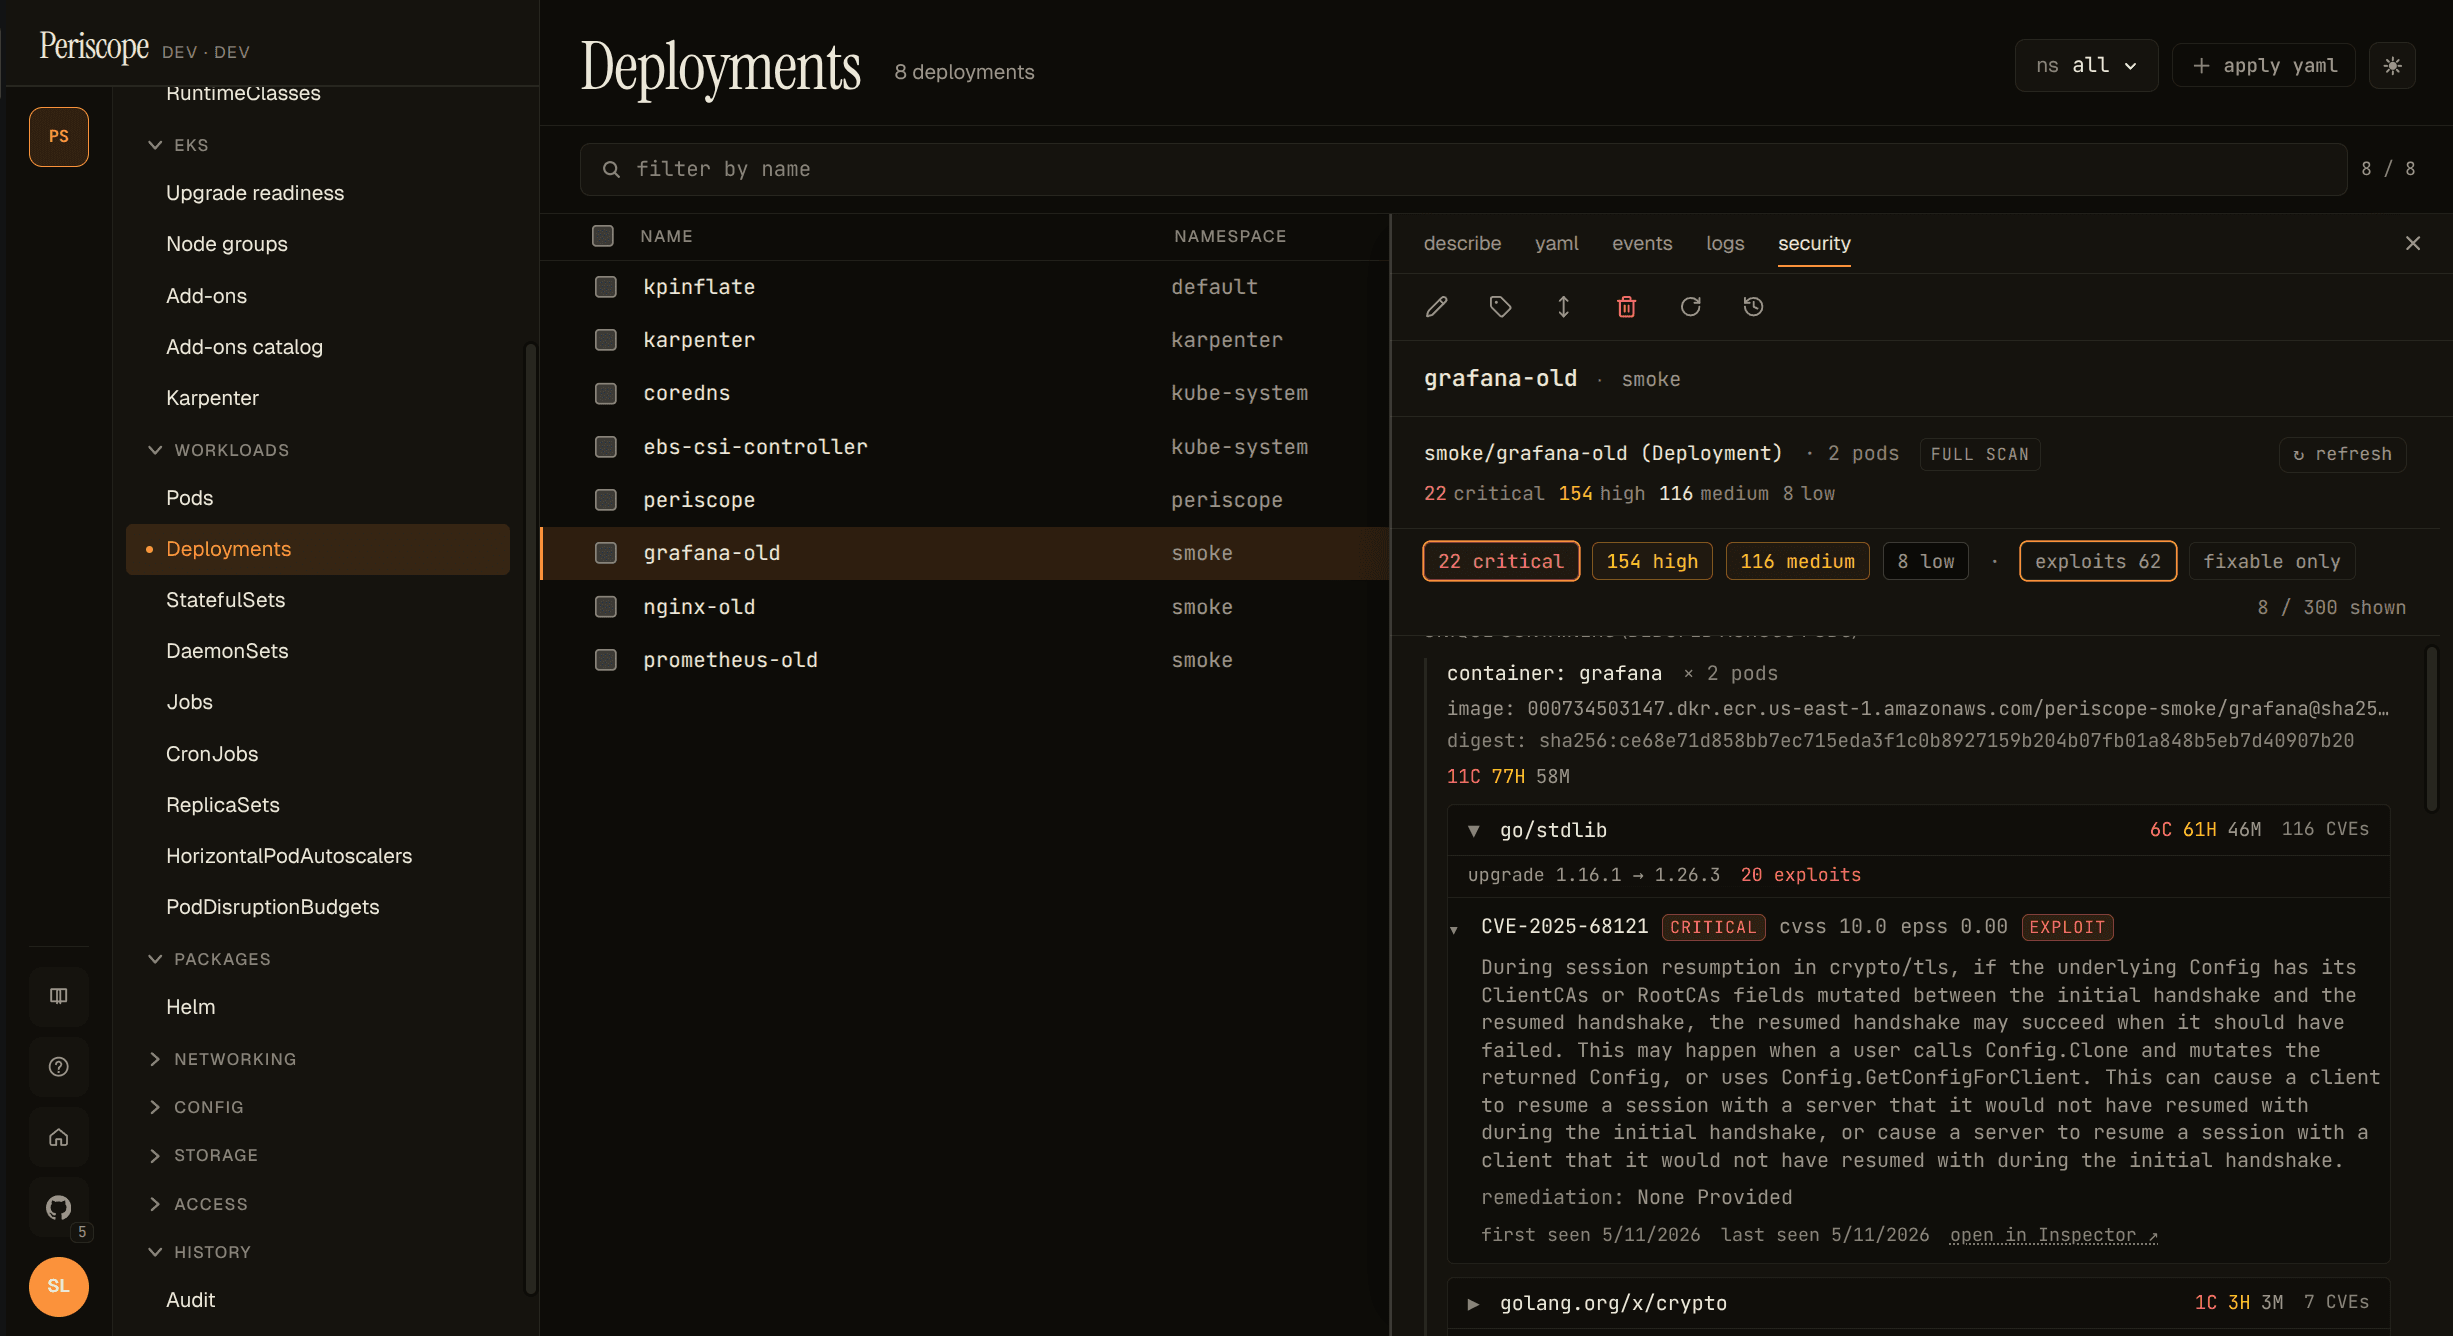
Per-container findings are grouped by package server-side. A
typical container with 200+ raw Inspector findings collapses to
roughly 5-20 package groups, because most findings are CVEs in the
same upstream package (the v1.1 smoke against grafana:8.0.0
shipped 116 go/stdlib CVEs in one group + a handful of single-CVE
groups for golang.org/x/crypto, golang.org/x/net, etc).
Each group header shows the package name, a compact severity chip,
the suggested upgrade target ("upgrade 1.16.1 → 1.26.3 fixes
all"), and the exploit / fixability hints when they're non-zero.
Expand the header to see the per-CVE rows, pre-sorted by triage
priority (exploit-available > severity > CVSS > EPSS).
The highest-priority group opens by default, so the most actionable CVEs are visible without an extra click; the long tail stays collapsed.
Filter chips
Above the per-container groups, a chip strip lets the operator focus:
- Severity chips —
N critical,N high,N medium,N low. Click one to filter to that severity only; click again to clear. exploits N— toggle to show only findings withexploitAvailable: YES. The single biggest signal for "what to fix today".fixable only— hide findings with no published fix. Useful late in a release window when un-fixable rows are noise.X / Y shownindicator on the right when filters are active.
Filters are client-side (no backend roundtrip on toggle). The underlying group + sort happens once on the server; chip toggles just hide rows from view.
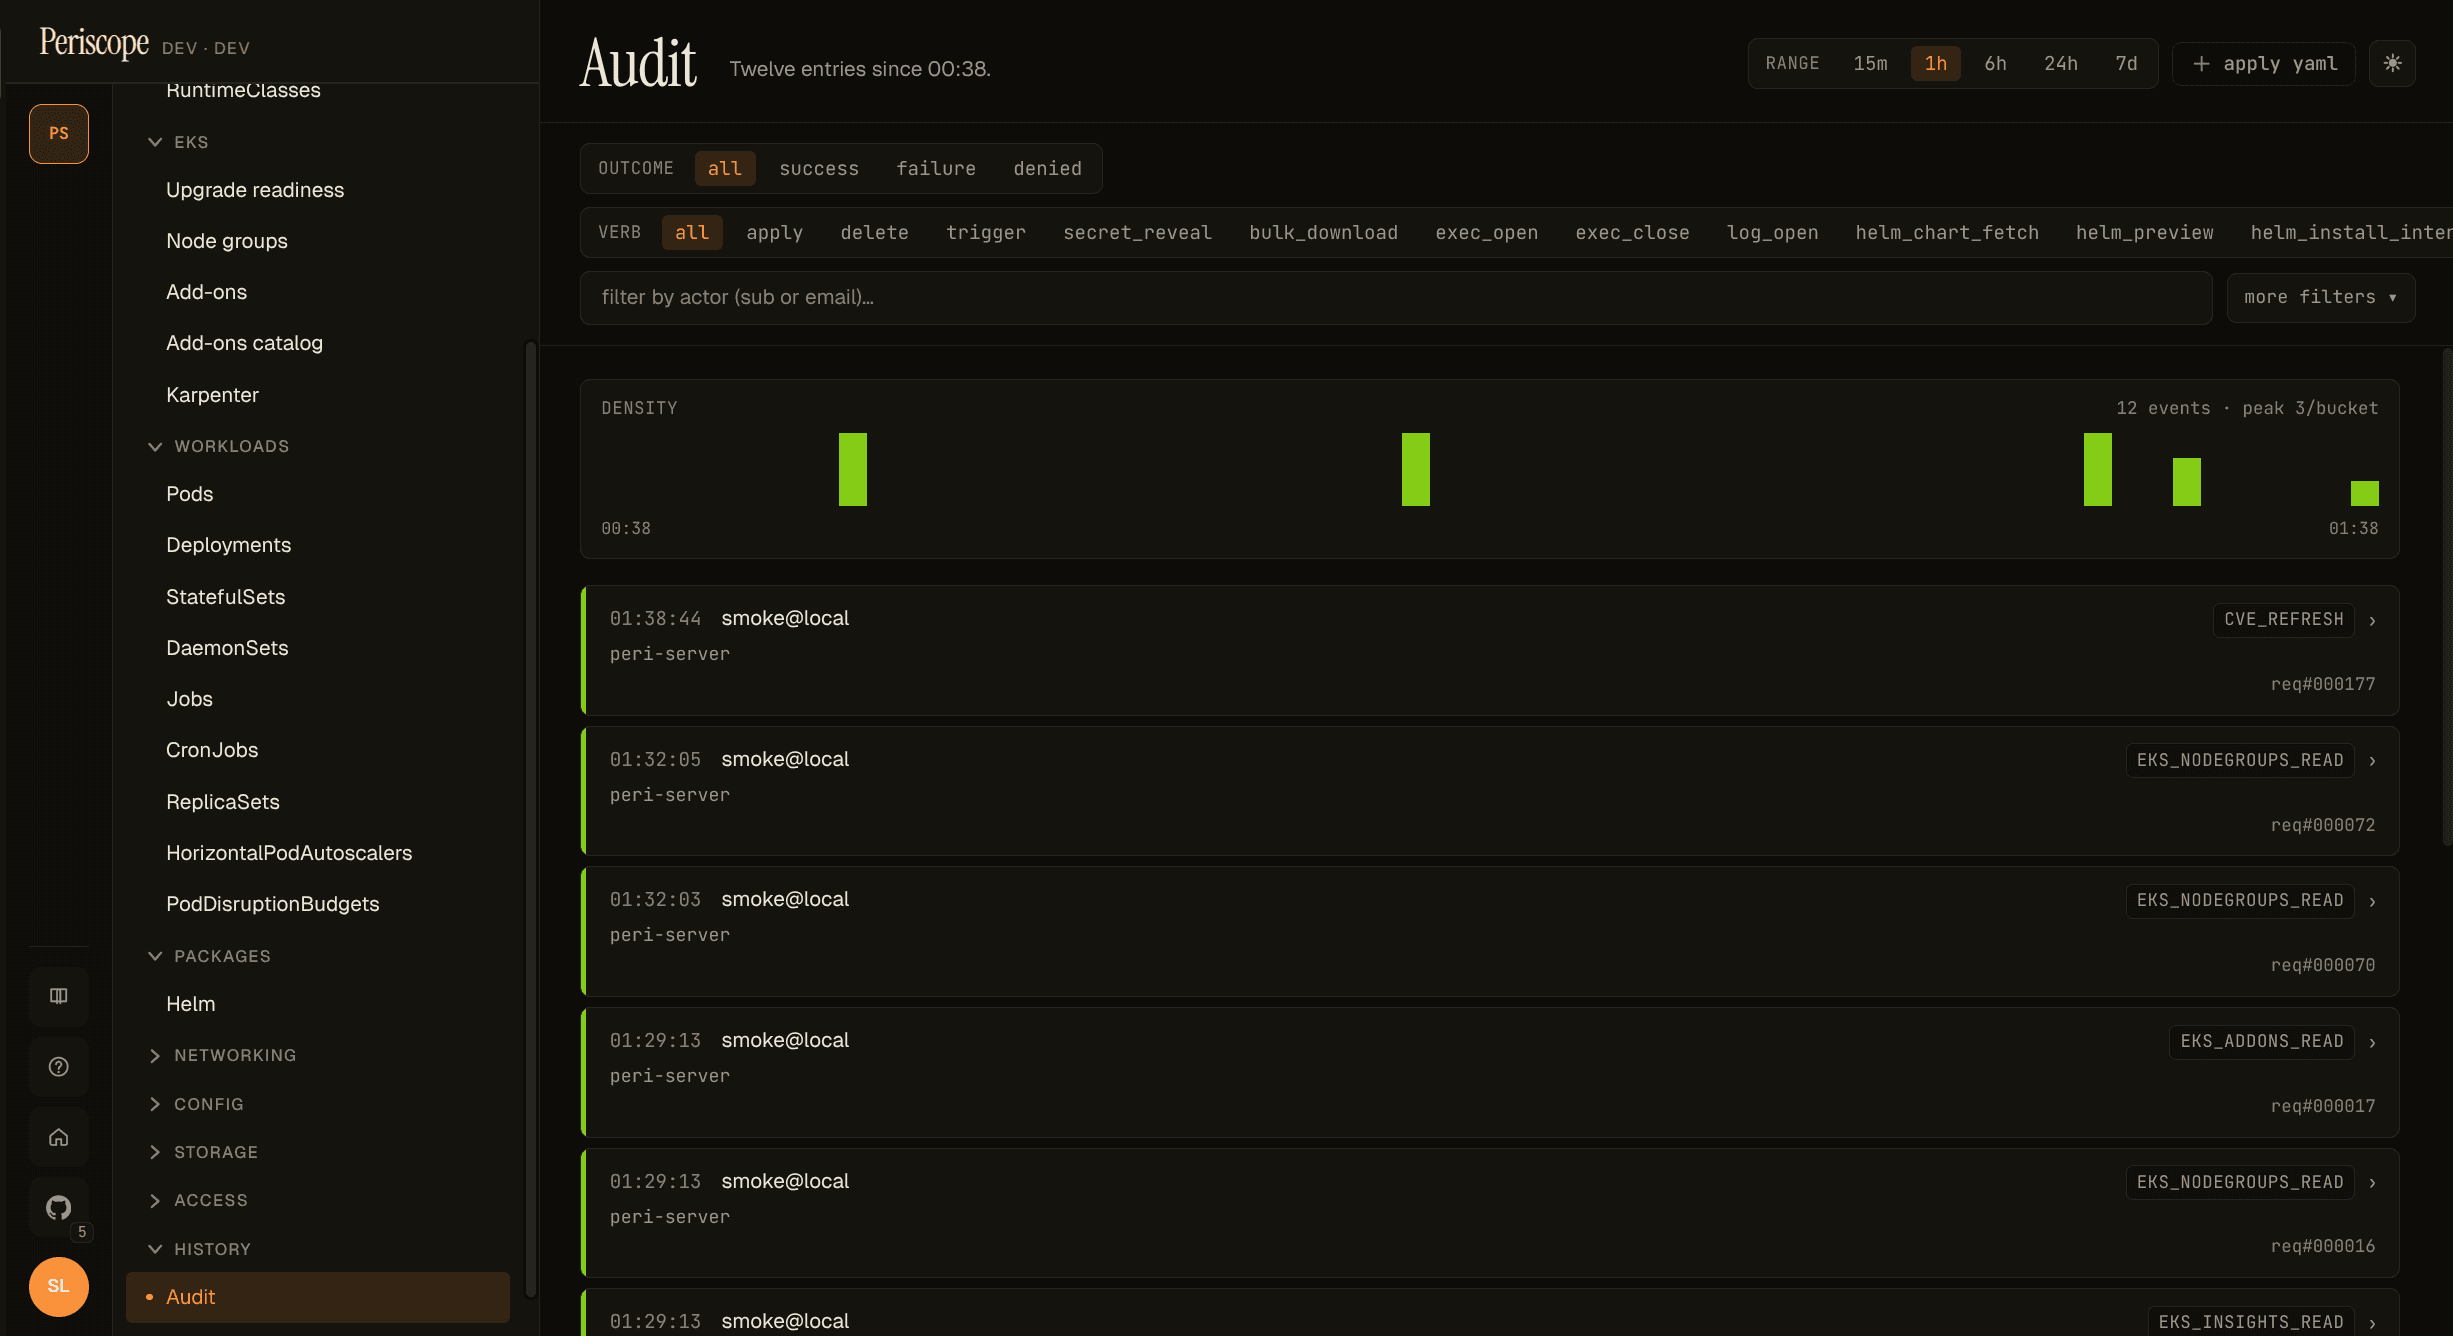
Refresh manually
Each Security tab carries an entity-scoped ↻ refresh button at
the top right. Clicking it forces an immediate Inspector re-scan of
the digests / instance IDs in scope and writes one cve_refresh
audit row carrying the affected resource IDs. Use it to verify a
fix landed without waiting for the 6-hour TTL refresh tick.
The button is disabled when the operator's role doesn't have the
cve_refresh audit verb. There is no page-level refresh (the
operator's intent — refresh which digests, which instances? — is
ambiguous at the page level); the entity-scoped button is the only
refresh shape in v1.1.
Empty states
No findings (· clean ·)
A scanned ECR container with zero CVEs renders as a muted "clean" chip plus a "no findings" body. Important reassurance — this is what success looks like.
Non-ECR images
Inspector v2 covers ECR-pulled images only. A non-ECR pod (Docker
Hub, GHCR, Quay, etc.) renders a graceful non-ECR · not scanned
state instead of a confusing zero-counts chip — Periscope is
explicit about why there's no data.
Inspector v2 disabled
Cluster-wide banner described above — yellow hairline at the top of
every CVE-aware page when the /cve/status endpoint reports
inspectorEnabled: false. Operators dismiss once per cluster (the
banner re-appears when they switch to a different cluster that's
also disabled).
Bare-metal or pre-Initialized NodeClaim
A Node without an EC2 providerID (kind, bare-metal, an
unprovisioned Karpenter NodeClaim) renders the Security tab as
"no scan possible — instance not on a cloud provider Periscope
can introspect". Not an error; the operator gets a clear "by
design" explanation.
What partial scan means
A pod with one ECR container plus a non-ECR sidecar (say
docker.io/library/nginx) reports partial scan coverage. The ECR
container is scanned and contributes to the rolled-up severity
counts; the sidecar shows non-ECR · not scanned. The pod-level
chip downgrades to partial so operators don't read the rollup as
"this pod is fully clean" when one image was skipped by Inspector
entirely.
What gets scanned, what doesn't
- ECR images Periscope can resolve to a
sha256:digest from the pod'scontainerStatus.imageIDfield: scanned. - ECR images not yet pulled by the pod (no digest): pending. The next refresh / TTL tick should resolve them.
- Non-ECR images (
docker.io,ghcr.io,quay.io, etc.): never scanned. Inspector v2's coverage is ECR-only. - EC2 instances are scanned at the OS-package level via Inspector's
instance coverage. Karpenter NodeClaims pre-
Initialized(no providerID yet) arenot scanned.
What isn't covered (yet)
- CronJob ownership chain is three-hop (Pod → Job → CronJob) and is not surfaced; this is tracked for v1.2.
- ReplicaSet and Job detail panes don't have a Security
tab today because the SPA's detail-pane wiring for those
resources is thin / non-existent. The backend already supports
/cve/by-workload/ReplicaSet/...andJob/...; the tab lands if / when those panes mature. - NodeGroup row-level chip: the SPA's nodegroup data doesn't include the instance ID list per group. Operators get per-node chips on the Nodes page and the per-instance Security tab on each node; the aggregate-by-group chip is a follow-up.
- Deployment / STS / DS list row chip column — see the "Read the row chip" section above. Detail-pane tab covers the per-workload story for v1.1.
Audit + cost
- Reads of any CVE endpoint do not emit audit rows — they're internal metadata reads. CloudTrail records the underlying Inspector API calls under the periscope-server's Pod Identity / IRSA role.
- Manual refresh emits exactly one
cve_refreshaudit row per click, carrying the affected digests + instance IDs in theExtrafield. - Inspector v2 is billed per scan at the AWS account level. See Inspector pricing. Periscope serves chip data from a 6h-TTL cache; the per-scan cost is the operator's call when they enable the feature. A typical ECR repo with weekly image pushes runs under $1/month per repo.
For tool / agent integrations
The package-grouping + priority-sort is computed server-side in
internal/cve/findings_group.go and surfaced on the same wire
shape the SPA renders from. That's intentional: when the future
v1.2 AI-agent epic (#151) wires an MCP-style tool registry, an LLM
calling /cve/by-workload/Deployment/{ns}/{name} receives:
- pre-grouped packages (the actionable units, not 200 raw CVEs)
- pre-sorted by triage priority (exploits → severity → CVSS → EPSS)
- per-group "upgrade
X.Y.Z→A.B.Cfixes all" hints
Both consumers — the human operator at the SPA and the LLM in the chat surface — see one source of truth for "what to fix first" prioritization. No second representation, no separate "agent- friendly" endpoint.