docssetuppod exec
Pod exec
Periscope ships an interactive shell into containers — the "Open Shell" button on a pod's detail page upgrades the page to a WebSocket and the binary streams stdin / stdout / stderr from the kube-apiserver under the u…
Periscope ships an interactive shell into containers — the "Open Shell" button on a pod's detail page upgrades the page to a WebSocket and the binary streams stdin / stdout / stderr from the kube-apiserver under the user's impersonated identity.
This page is the operator guide: when it's enabled, how to tune timeouts and caps, how the WebSocket-vs-SPDY transport selection works, and what to do when things misbehave. The design is in RFC 0001.
What you see
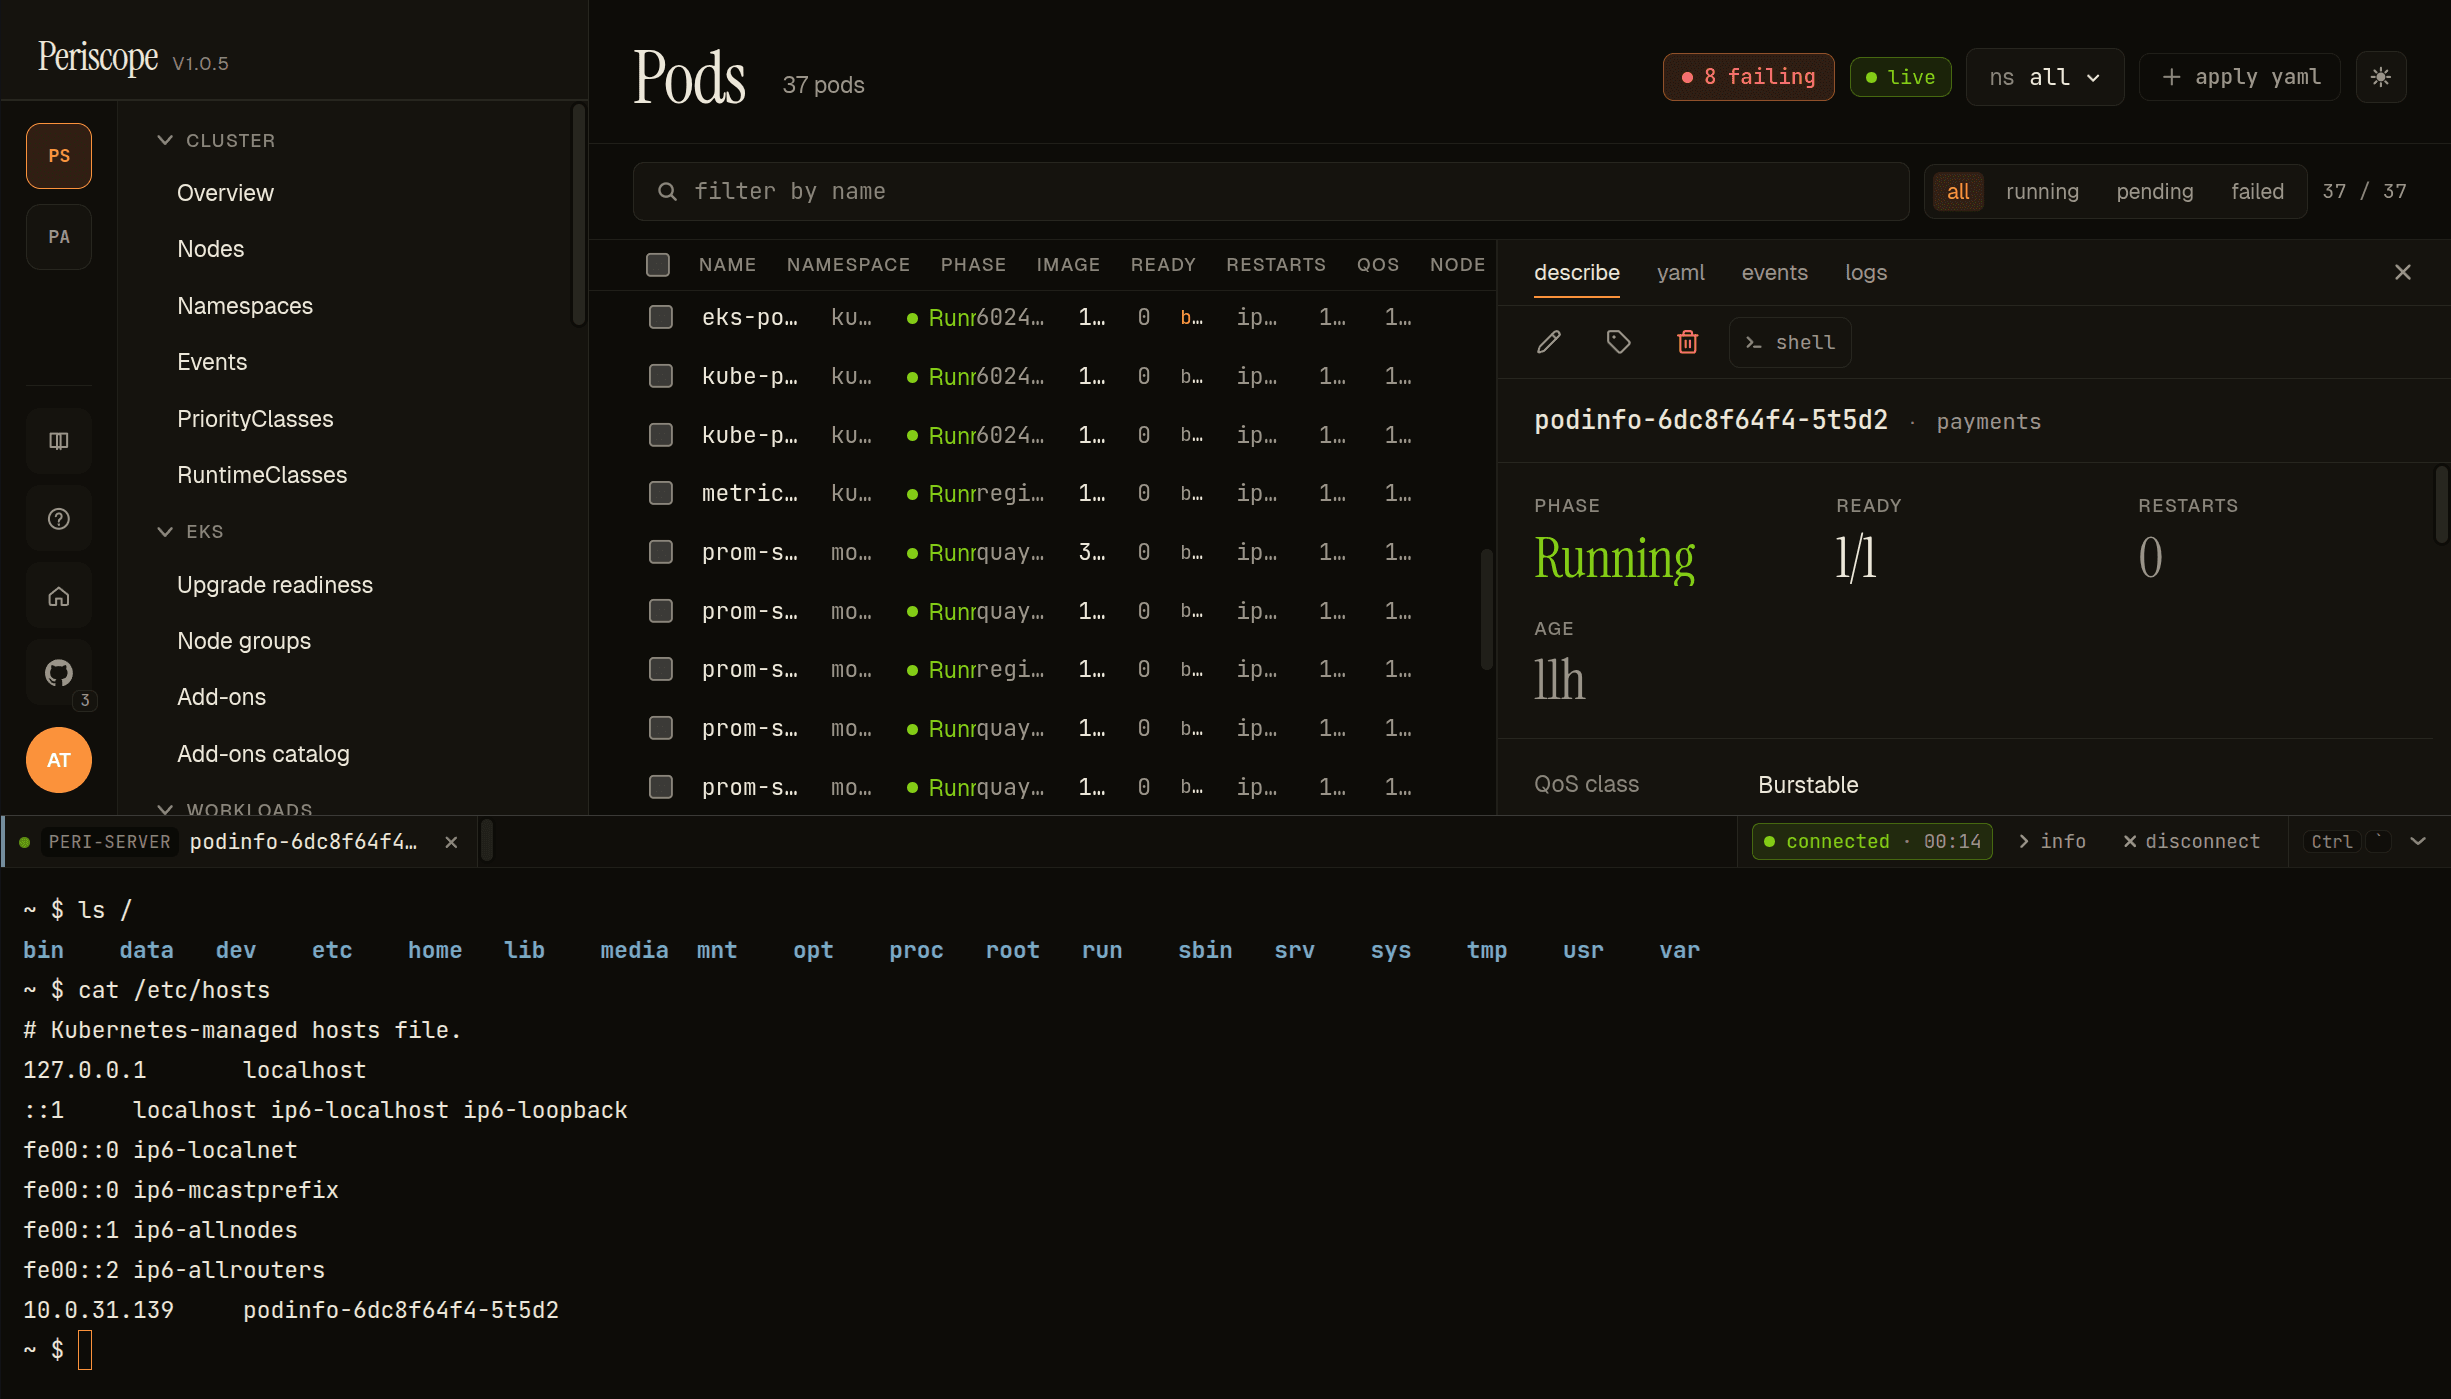
Click Open Shell on any pod's detail page. Periscope opens a slide-up terminal panel at the bottom of the SPA with an attached xterm.js shell — the rest of the SPA stays visible above so you can keep navigating the workload list while a session is open. The panel header shows the cluster name, the pod and container the session is attached to, a connection state pill (connected · MM:SS while live, disconnected after timeout or close), and info + disconnect actions. The shell streams stdin / stdout / stderr through a WebSocket to the kube-apiserver under your impersonated identity, and reconnects automatically on transient drops.
1. Default behavior
Pod exec is on by default for every cluster in the registry. The
helm chart unconditionally registers the route; per-cluster opt-out
is the only kill switch. There is intentionally no global
exec.enabled toggle — disabling means setting it false on each
cluster you want to lock down.
Backend support matrix
| Backend | Exec works? | Notes |
|---|---|---|
eks (Pod Identity / IRSA) | Yes | Direct apiserver dial; standard WS / SPDY upgrade |
kubeconfig | Yes | Same as eks |
in-cluster | Yes | Same |
agent | Yes (since v1.0.0) | Routes via the loopback CONNECT proxy through the agent tunnel; transparent to the operator. See Operator notes for agent-backed clusters below, docs/architecture/agent-tunnel.md for the integration details, and RFC 0004 for the validation harness. |
Operator notes for agent-backed clusters
Pod exec on backend: agent clusters works through the same Helm
values, RBAC, audit, and SPA flow as any other backend — but the
transport path is longer, so a few operator-facing implications are
worth knowing.
The same toggles apply. All settings under 2 and 3 — global
defaults, per-cluster overrides, exec.enabled: false,
maxSessionsPerUser, serverIdleSeconds — work identically on
agent-backed clusters. There is no separate agent.exec.* block.
Transport path. A pod-exec request on an agent-backed cluster
flows: browser → server WS handler → internal/k8s/exec.go builds
a remotecommand.NewWebSocketExecutor (or SPDY) → a loopback HTTP
CONNECT proxy in internal/k8s/agent_exec_proxy.go translates the
per-cluster CONNECT into a tunnel dial → rancher/remotedialer
multiplexes it onto the agent's long-lived WebSocket → the agent's
httputil.ReverseProxy (with a Hijack() shim for upgrade traffic)
re-issues the request to the local apiserver with the agent SA
bearer token. WS v5 vs SPDY transport selection (4) and circuit-
breaker behavior happen on the server end; the agent is unaware.
Why the loopback CONNECT proxy. client-go's WS / SPDY exec
executors bypass rest.Config.Transport entirely (they dial via
DNS), so the same trick that makes list/watch/apply transparent
to handlers — substituting rest.Config.Transport — does not
work for exec. The CONNECT proxy is the additive seam that closes
that gap. Operators don't configure it; the server registers a
loopback listener at startup.
RBAC is unchanged. pods/exec create permission still applies
in the target cluster's namespace, evaluated under the human's
impersonated identity. The agent's SA needs only its standard
impersonate lever (see docs/setup/cluster-rbac.md
"Agent backend"). No additional RBAC for exec specifically.
Audit is unchanged. pod.exec.session_start /
pod.exec.session_end records emit on the central server, with
the same fields described in 7. The cluster: field carries the
agent-backed cluster's registry name.
Latency. First-exec latency on an agent-backed cluster is typically ~100ms higher than a direct backend (the extra hop through the tunnel and the agent's reverse proxy). Steady-state keystroke latency is dominated by the agent → apiserver hop, which is in-cluster on the managed side, so it's usually negligible. If you regularly see >500ms keystroke latency, the bottleneck is between the central server and the agent — investigate the WS path through proxies / NLBs.
Disconnect behavior. If the agent tunnel drops mid-session,
the WebSocket exec stream dies with it; the SPA shows the standard
"session ended" UI. Reconnect requires a fresh shell — the exec
session is not resumable across tunnel reconnects (this is the
same behavior as a direct-backend kubectl exec losing its TCP
connection). The agent itself reconnects on jittered backoff
within 1–30s; subsequent shell opens succeed normally.
Per-cluster opt-out
clusters:
  - name: prod-eu-west-1
    backend: eks
    region: eu-west-1
    arn: arn:aws:eks:eu-west-1:222222222222:cluster/prod-eu-west-1
  - name: locked-down
    backend: eks
    region: us-west-2
    arn: arn:aws:eks:us-west-2:333333333333:cluster/locked
    exec:
      enabled: false
When exec.enabled: false for a cluster:
- The SPA hides the Open Shell action on that cluster's pods.
- A direct WebSocket request to
/api/clusters/locked-down/pods/.../execreturns HTTP 403 with body{"error": "E_EXEC_DISABLED"}. - The cluster summary surfaces
execEnabled: falsefor SPA gating.
Required RBAC
The impersonated user must hold create on the pods/exec
subresource in the pod's namespace. The shipped tier ClusterRoles
grant this by default for triage, write, maintain, and admin;
read does not include it (see
docs/setup/cluster-rbac.md for the verb
appendix).
2. Tuning the global defaults
Helm exposes the global timing and cap defaults under exec::
exec:
  serverIdleSeconds: 600   # tear-down after this much stdin/stdout silence
  idleWarnSeconds: 30      # browser warning lead before the cut
  heartbeatSeconds: 20     # WebSocket ping interval
  maxSessionsPerUser: 5    # concurrent sessions per OIDC subject
  maxSessionsTotal: 50     # concurrent sessions per cluster, total
  probeClustersOnBoot: false
Each value renders to a PERISCOPE_EXEC_* environment variable on the
Periscope pod (or PERISCOPE_PROBE_CLUSTERS_ON_BOOT=1 for the boot
probe). The mapping below covers exec specifically; the cross-cutting
reference for every env var the binary reads is
environment-variables.md.
| Helm value | Env var | Code default |
|---|---|---|
exec.serverIdleSeconds | PERISCOPE_EXEC_IDLE_SECONDS | 600 (10 min) |
exec.idleWarnSeconds | PERISCOPE_EXEC_IDLE_WARN_SECONDS | 30 |
exec.heartbeatSeconds | PERISCOPE_EXEC_HEARTBEAT_SECONDS | 20 |
exec.maxSessionsPerUser | PERISCOPE_EXEC_MAX_SESSIONS_PER_USER | 5 |
exec.maxSessionsTotal | PERISCOPE_EXEC_MAX_SESSIONS_TOTAL | 50 |
exec.probeClustersOnBoot | PERISCOPE_PROBE_CLUSTERS_ON_BOOT (1) | off |
3. Per-cluster overrides
Each cluster entry in clusters[] may override any of the global
defaults. Overrides are partial — list only the fields that
differ; everything else falls through to the global default.
exec:
  serverIdleSeconds: 600
  maxSessionsPerUser: 5

clusters:
  - name: prod
    backend: eks
    region: us-east-1
    arn: arn:aws:eks:us-east-1:111111111111:cluster/prod
    exec:
      # Long-running prod incident response: 30-min idle, 10 sessions/user.
      serverIdleSeconds: 1800
      maxSessionsPerUser: 10

  - name: dev
    backend: eks
    region: us-east-1
    arn: arn:aws:eks:us-east-1:111111111111:cluster/dev
    # No exec block → uses globals (10 min idle, 5 sessions/user).
The available per-cluster keys are:
| Key | Type | Notes |
|---|---|---|
enabled | bool | false disables exec entirely on this cluster |
serverIdleSeconds | int | overrides global idle timeout |
idleWarnSeconds | int | overrides global warning lead |
heartbeatSeconds | int | overrides global heartbeat |
maxSessionsPerUser | int | overrides global per-user cap |
maxSessionsTotal | int | overrides global per-cluster cap |
A non-positive override is treated as "operator typo, ignore" — the global default stays in effect.
4. Transports: WebSocket v5 + SPDY fallback
Periscope prefers WebSocket v5 (Kubernetes 1.30+, subprotocol
v5.channel.k8s.io) and falls back to SPDY for older clusters.
Per-cluster selection is automatic.
A circuit breaker sits in front of the transport pick: if WebSocket upgrade fails 3 times in a row for a given cluster, the transport pins to SPDY for 30 minutes and self-heals afterward. This is invisible to end users — sessions just keep working.
Boot-time probe (optional)
Set exec.probeClustersOnBoot: true to pre-warm each cluster's
credentials and exec policy at startup. First-exec latency on a cold
cluster (cold IAM cache + Access Entry resolution + transport probe)
is typically 3–5 seconds; the boot probe trades that latency for
slightly slower pod startup. Off by default.
5. Concurrency caps
Two caps gate every WebSocket upgrade:
- Per-user (default 5): concurrent sessions per OIDC subject,
across every cluster they have access to. Hitting the cap returns
HTTP 429 with body
{"error":"E_CAP_USER","activeSessions":[...]}. - Per-cluster total (default 50): concurrent sessions per cluster
regardless of user. Hitting the cap returns HTTP 429 with
{"error":"E_CAP_CLUSTER",...}.
The active-sessions list in the 429 body lets the SPA render a "You're already exec'd into …, close one to start a new session" UI.
Each session pins ~1 MiB of stdin/stdout buffers in the Periscope pod plus one apiserver watch connection. Cap the total at a number you have memory + apiserver-connection budget for.
6. Lifecycle: idle, heartbeat, warn, close
Per session, four timers run concurrently:
| Timer | Default | Trigger |
|---|---|---|
| Heartbeat | 20s | Server sends WebSocket ping. Keeps proxies (NLB, ALB, ingress) from silently dropping the socket. |
| Server idle | 600s | No stdin or stdout activity for this long → server tears the session down. |
| Idle warn | 30s | Browser shows a "session ending soon" banner this many seconds before the server idle cut. |
| Client hidden | 300s | Browser tab hidden + no activity → SPA closes the session client-side. Tunable in the SPA, not in helm. |
Any keystroke or output frame resets the idle timer.
7. Audit
Each session emits two records to the audit pipeline (stdout + the
SQLite sink when audit.enabled=true):
| Event | When | Useful fields |
|---|---|---|
pod.exec.session_start | Upgrade succeeds | session_id, actor.sub, cluster, namespace, pod, container, tty, transport (ws / spdy), k8s_identity |
pod.exec.session_end | Server tears down or client closes | adds duration_ms, exit_code, bytes_stdin, bytes_stdout, close_reason (client_close / server_idle / forced_close) |
Query history with GET /api/audit?verb=pod.exec.session_start (when
audit persistence is on; see audit.md).
8. Troubleshooting
For cross-cutting issues that aren't pod-exec specific (chart-versions OOM, scanner false-positives, local-dev TLS, etc.) see troubleshooting.md.
"Open Shell" button is missing
Pod is on a cluster with exec.enabled: false, or the user lacks
pods/exec create permission in that namespace. Confirm with
POST /api/clusters/{cluster}/can-i for {verb: "create", resource: "pods/exec", namespace: "<ns>"}.
WebSocket upgrade fails (instant disconnect)
Most common causes, in order:
- TLS-termination strips the
Connection: upgradeheader. Check your ingress controller / NLB; the path/api/clusters/.../execneeds WebSocket support enabled. Originheader rejection. Some load balancers attach an Origin the WebSocket library doesn't recognise. The Periscope handler accepts same-origin only.- Cluster requires SPDY but k8s client picked WebSocket → wait 30 minutes and the circuit breaker pins to SPDY automatically; or restart the pod to reset the breaker.
Pod logs (kubectl -n periscope logs deploy/periscope) carry a
structured line per upgrade attempt with transport=ws|spdy,
upgrade_error=…, and circuit_breaker_state=….
"No shell in container" (E_NO_SHELL)
The container's image has no /bin/sh (distroless, scratch). Periscope
can't pick a shell for you in that case — exec needs an existing
binary in the image. Use kubectl debug semantics (ephemeral debug
container) instead; that's a v1.x feature.
HTTP 429 with activeSessions
User hit maxSessionsPerUser (or cluster hit maxSessionsTotal). The
response body lists the active sessions; close one or bump the cap.
Both caps support per-cluster overrides if a single cluster is the
hot spot.
Session disconnects every ~minute
Heartbeat isn't reaching the browser through your proxy chain. Set
exec.heartbeatSeconds: 10 (or even 5) so pings hit before the
proxy's idle-socket timeout. ALB defaults to 60s, NLB to 350s, NGINX
to 60s.
Session times out unexpectedly during long compiles
Bump exec.serverIdleSeconds for the affected cluster — long-running
build / debug sessions need a higher ceiling. A common pattern is
global = 600s (good default) with prod-debug cluster overridden
to 1800s.
Circuit breaker pinned to SPDY indefinitely
The breaker self-heals after 30 min. To force-reset, restart the Periscope pod. There's no operator-facing knob for this — pinning that long means real WebSocket failure that needs investigation upstream of Periscope.
Exec fails immediately on an agent-backed cluster
Direct backends (eks / kubeconfig / in-cluster) work but
shells on backend: agent clusters fail to upgrade. Most likely
causes, in order:
- Agent tunnel is down. Check the fleet view — if the cluster
card is "unreachable", the tunnel is the problem, not exec.
See
docs/setup/agent-onboarding.mdtroubleshooting. - Agent is on a pre-1.0.0 image. The
Hijack()shim incmd/periscope-agent/observability.goshipped in v1.0.0; older agents fail every WS / SPDY upgrade with"can't switch protocols using non-Hijacker ResponseWriter"in the agent log. Fix:helm upgrade periscope-agentto ≥ v1.0.0. - Agent SA lacks
pods/execcreate on the target namespace. Different from the user's RBAC: the agent's reverse proxy re-issues the request as itself (with Impersonate-* preserved), and the apiserver checks both the agent's RBAC and the impersonated user's RBAC. Default agent ClusterRole grants this; verify if you tightened it. - Tunnel WS path strips upgrade headers. Same root cause as
the 8 "WebSocket upgrade fails" bullet, but on the central-
server-to-agent leg. Check
agent.tunnelSANsand any intermediate LB.
Enable agent debug logging
(helm upgrade ... --set agent.logLevel=debug on the managed
cluster) and grep for proxy.request_in / proxy.apiserver_error
lines around the failed upgrade.
9. Observability
Per-pod metrics surface through the structured log lines:
exec.session.start/exec.session.end— every session boundary.exec.cap.hit— 429 responses, withcap=user|clusterand counts.exec.transport.choice—transport=ws|spdy,circuit_breaker=open|closed.exec.upgrade.error— failed WebSocket upgrades.
Tail with kubectl -n periscope logs deploy/periscope -f | grep exec.
For audit-grade history (who exec'd into what, when, for how long),
turn on the SQLite sink and query /api/audit?verb=pod.exec.session_start
— see audit.md.