docsusageworkloads
Workloads
The Workloads pages — Pods, Deployments, StatefulSets, DaemonSets, ReplicaSets, Jobs, CronJobs — share a column shape: name, namespace, ready/total, image, status, age. Each kind has its own list page with a detail pa…
The Workloads pages — Pods, Deployments, StatefulSets, DaemonSets, ReplicaSets, Jobs, CronJobs — share a column shape: name, namespace, ready/total, image, status, age. Each kind has its own list page with a detail pane that drills into describe / YAML / events / logs tabs.
This page covers the cross-cutting view; per-kind specifics (e.g.
DaemonSet's misscheduled count, CronJob's last-success time) live
in the existing kubectl reference. The Periscope-specific story is
in the image + QoS columns and the live logs experience.
Pods list
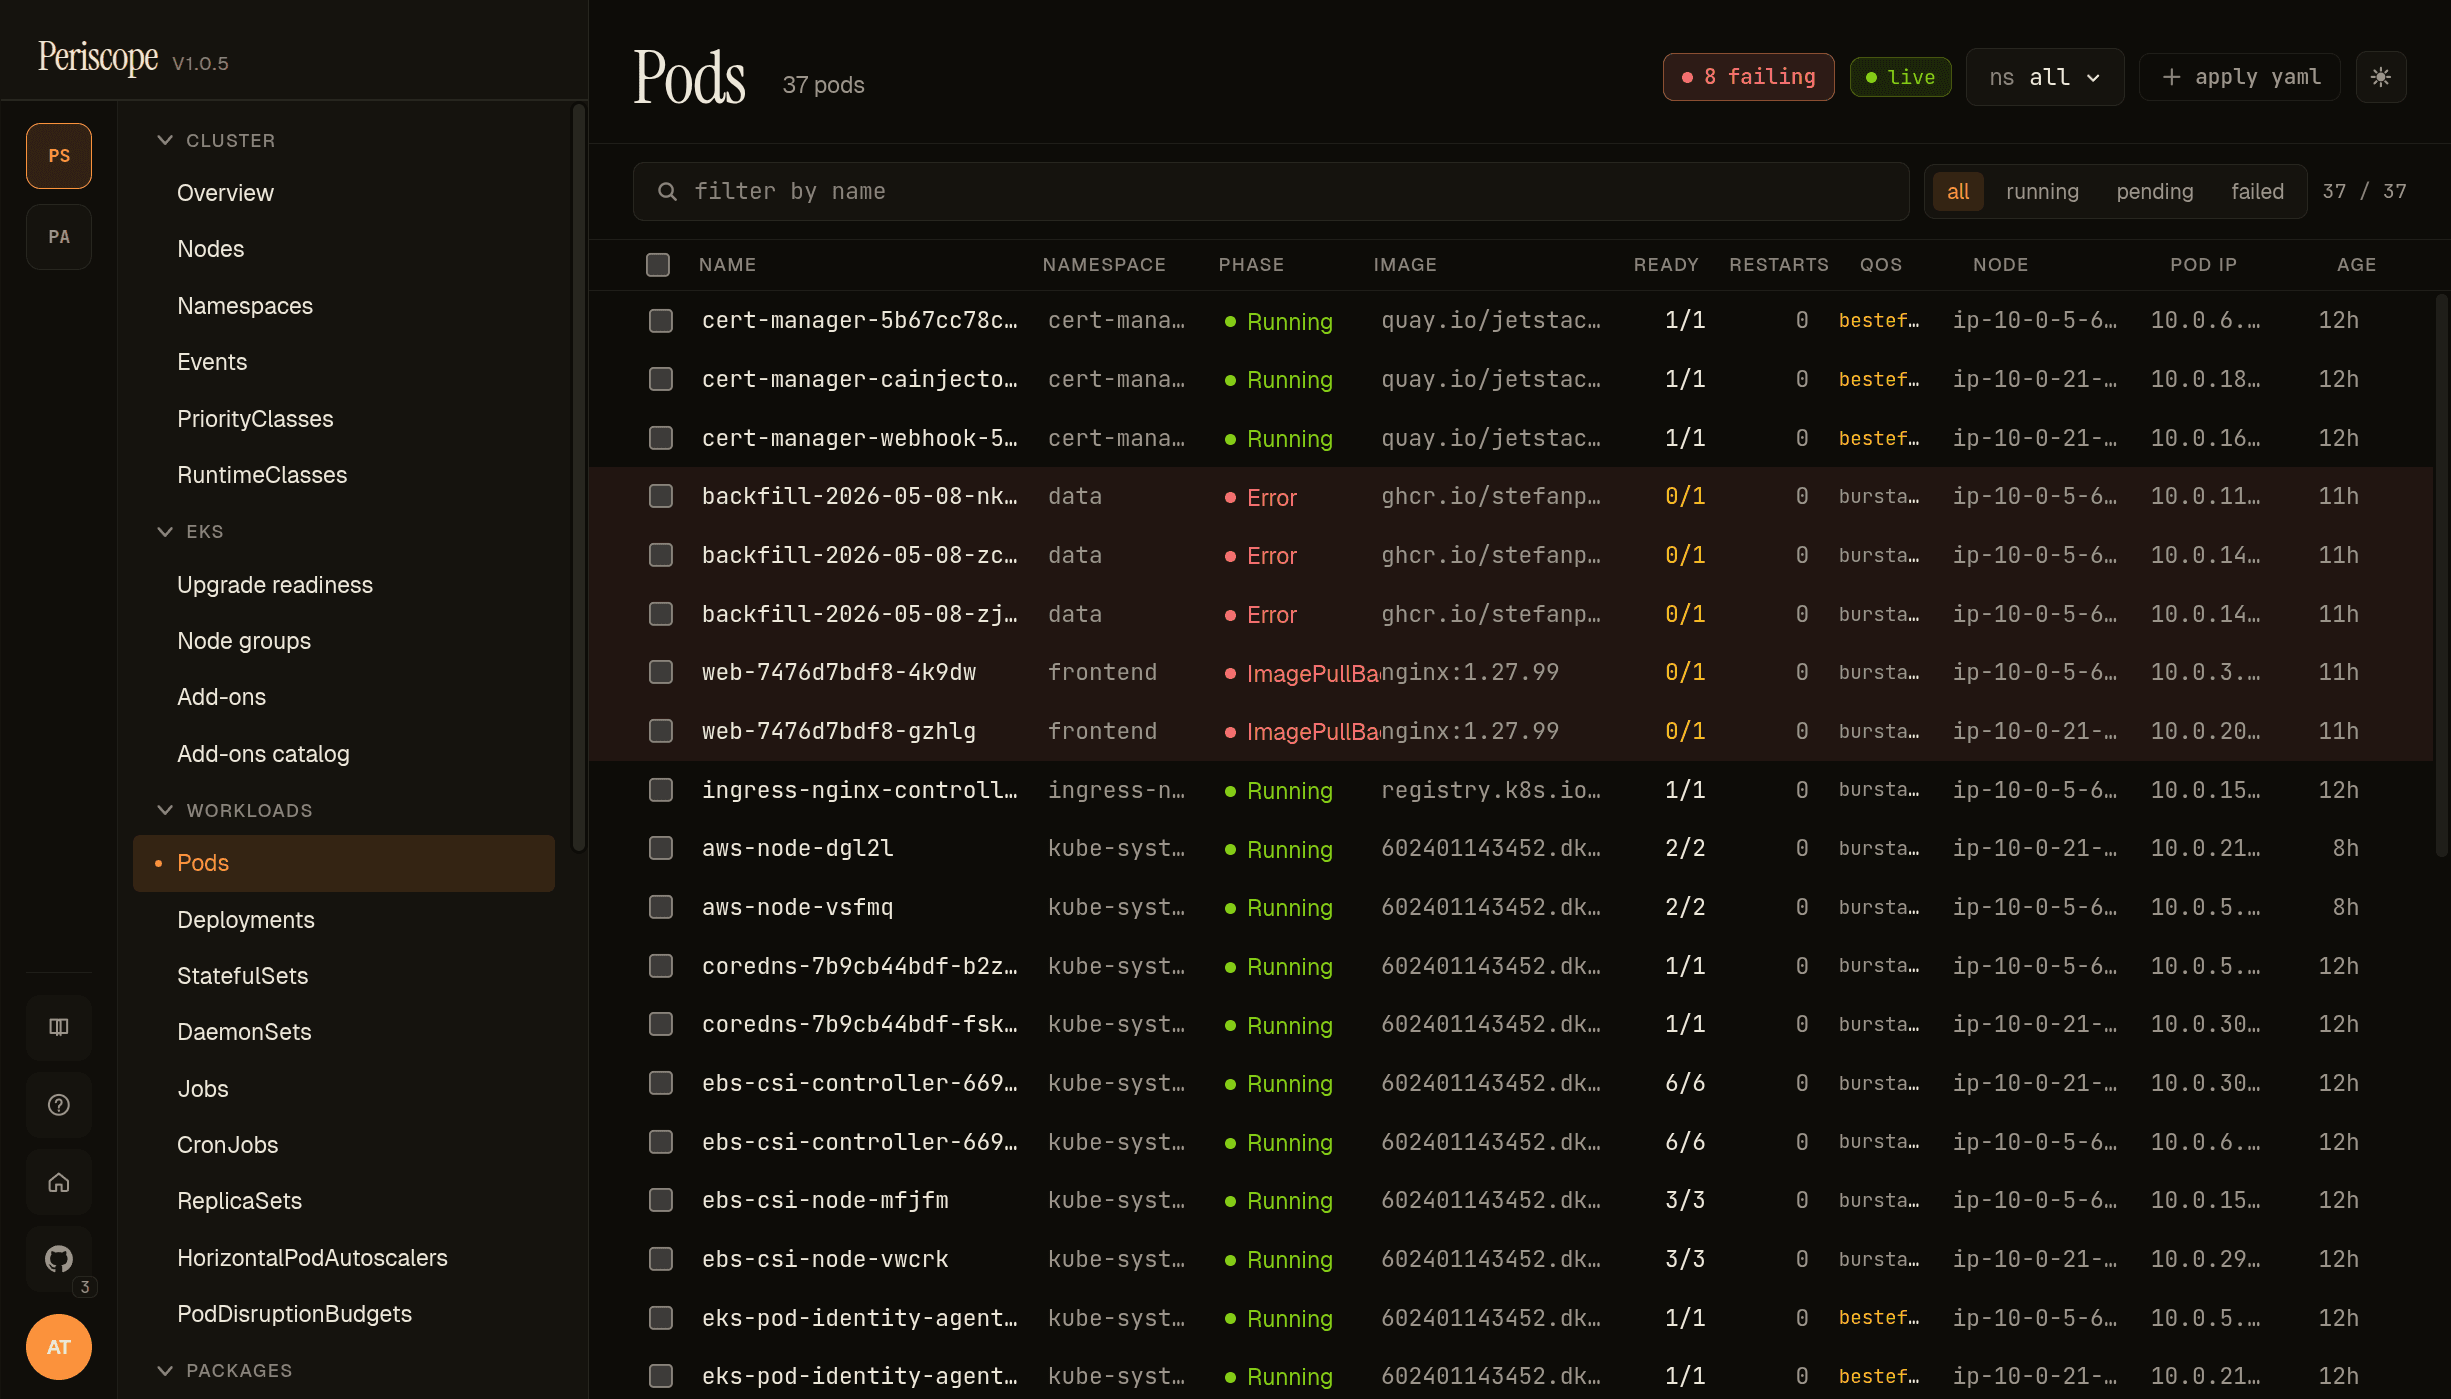
The pods list adds a few columns kubectl-get doesn't:
- Image — the first container's image in the pod, truncated
with full path in the row's title tooltip. When a pod has > 1
container, a small
+Nbadge follows the image to surface multi-container pods at scroll glance. - QoS — the kubectl-style class (Guaranteed, Burstable, BestEffort). BestEffort renders yellow because those pods get evicted first when the node hits memory pressure — informs the "who gets killed first" question without opening describe.
- Restarts — coloured by severity:
0muted,1-5neutral,>5yellow, terminal failuresred. - Phase — Running / Pending / Succeeded / Failed / Unknown plus a synthesized Stuck for pods reporting a wait/term reason kubectl flags as broken (CrashLoopBackOff, ImagePullBackOff, RunContainerError). Stuck rows tint red.
Filtering: namespace picker in the top strip; search by name in the
filter strip below; a status pills row offers phase=Stuck /
phase=Pending / phase=Failed quick filters.
Pod detail
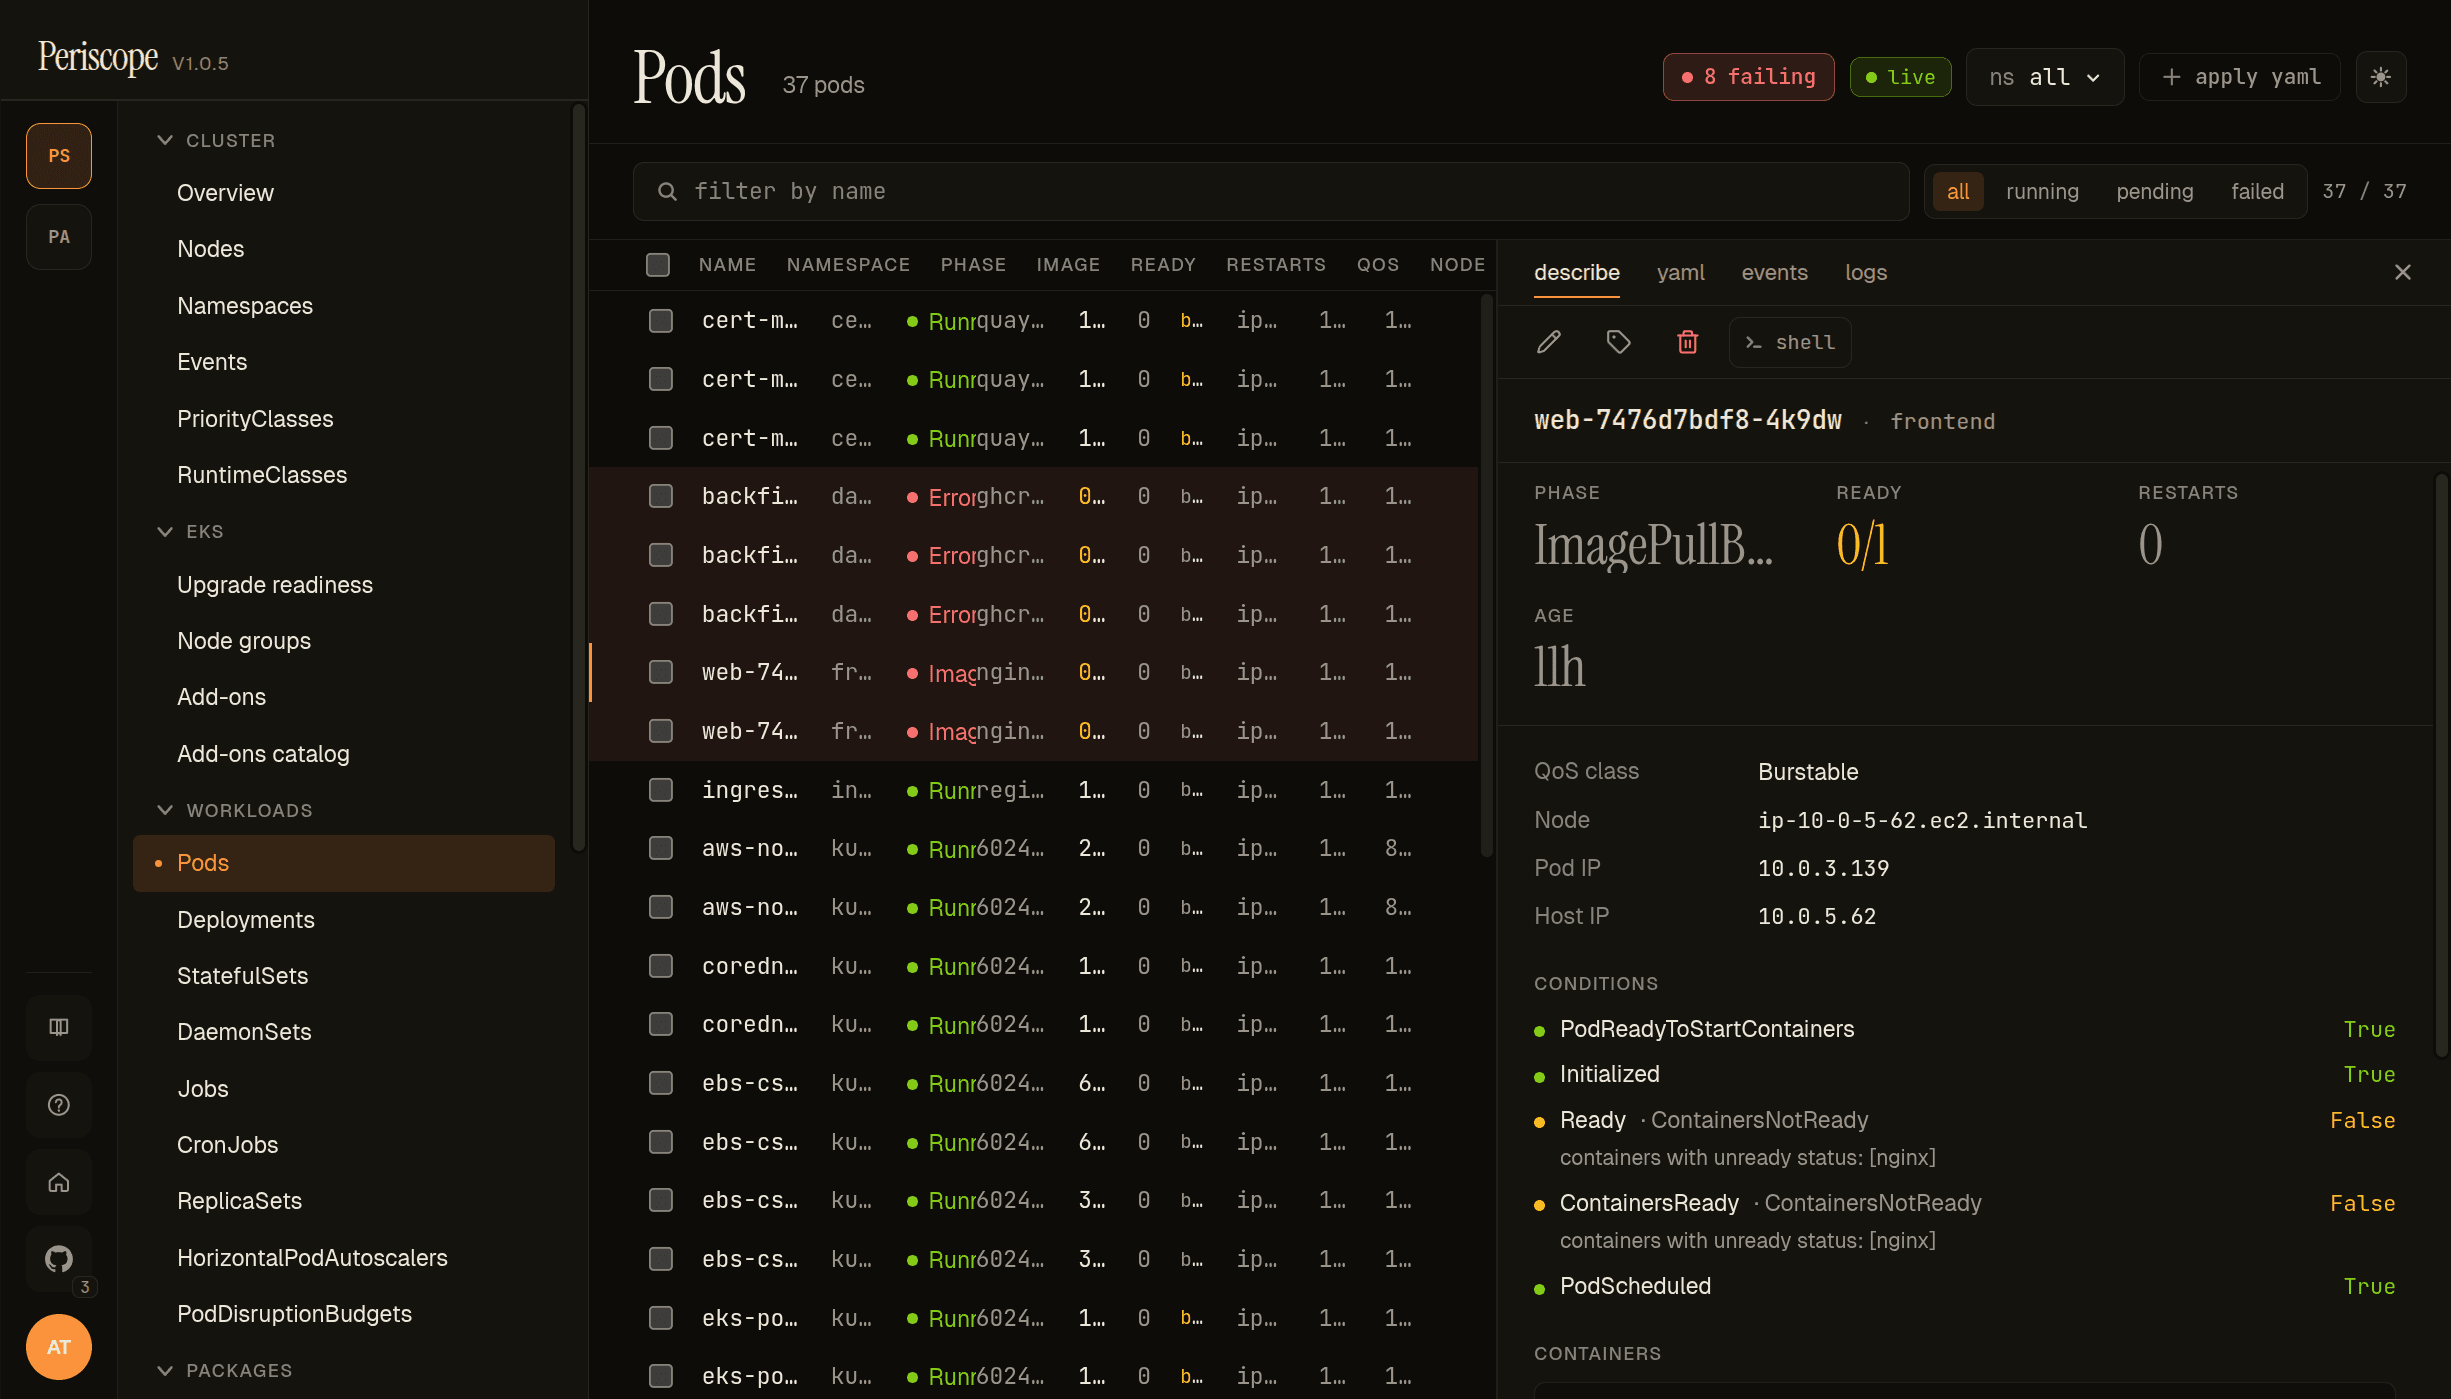
Clicking a row opens the right-pane detail. Tabs:
- Describe — kubectl-describe-equivalent summary. Containers block expands per-container with image, last state, restart count, ready-and-started flags.
- YAML — Monaco-editor read-only view of the live pod manifest.
- Events — see below.
- Logs — see below.
- Exec — the Open Shell action.
Events tab
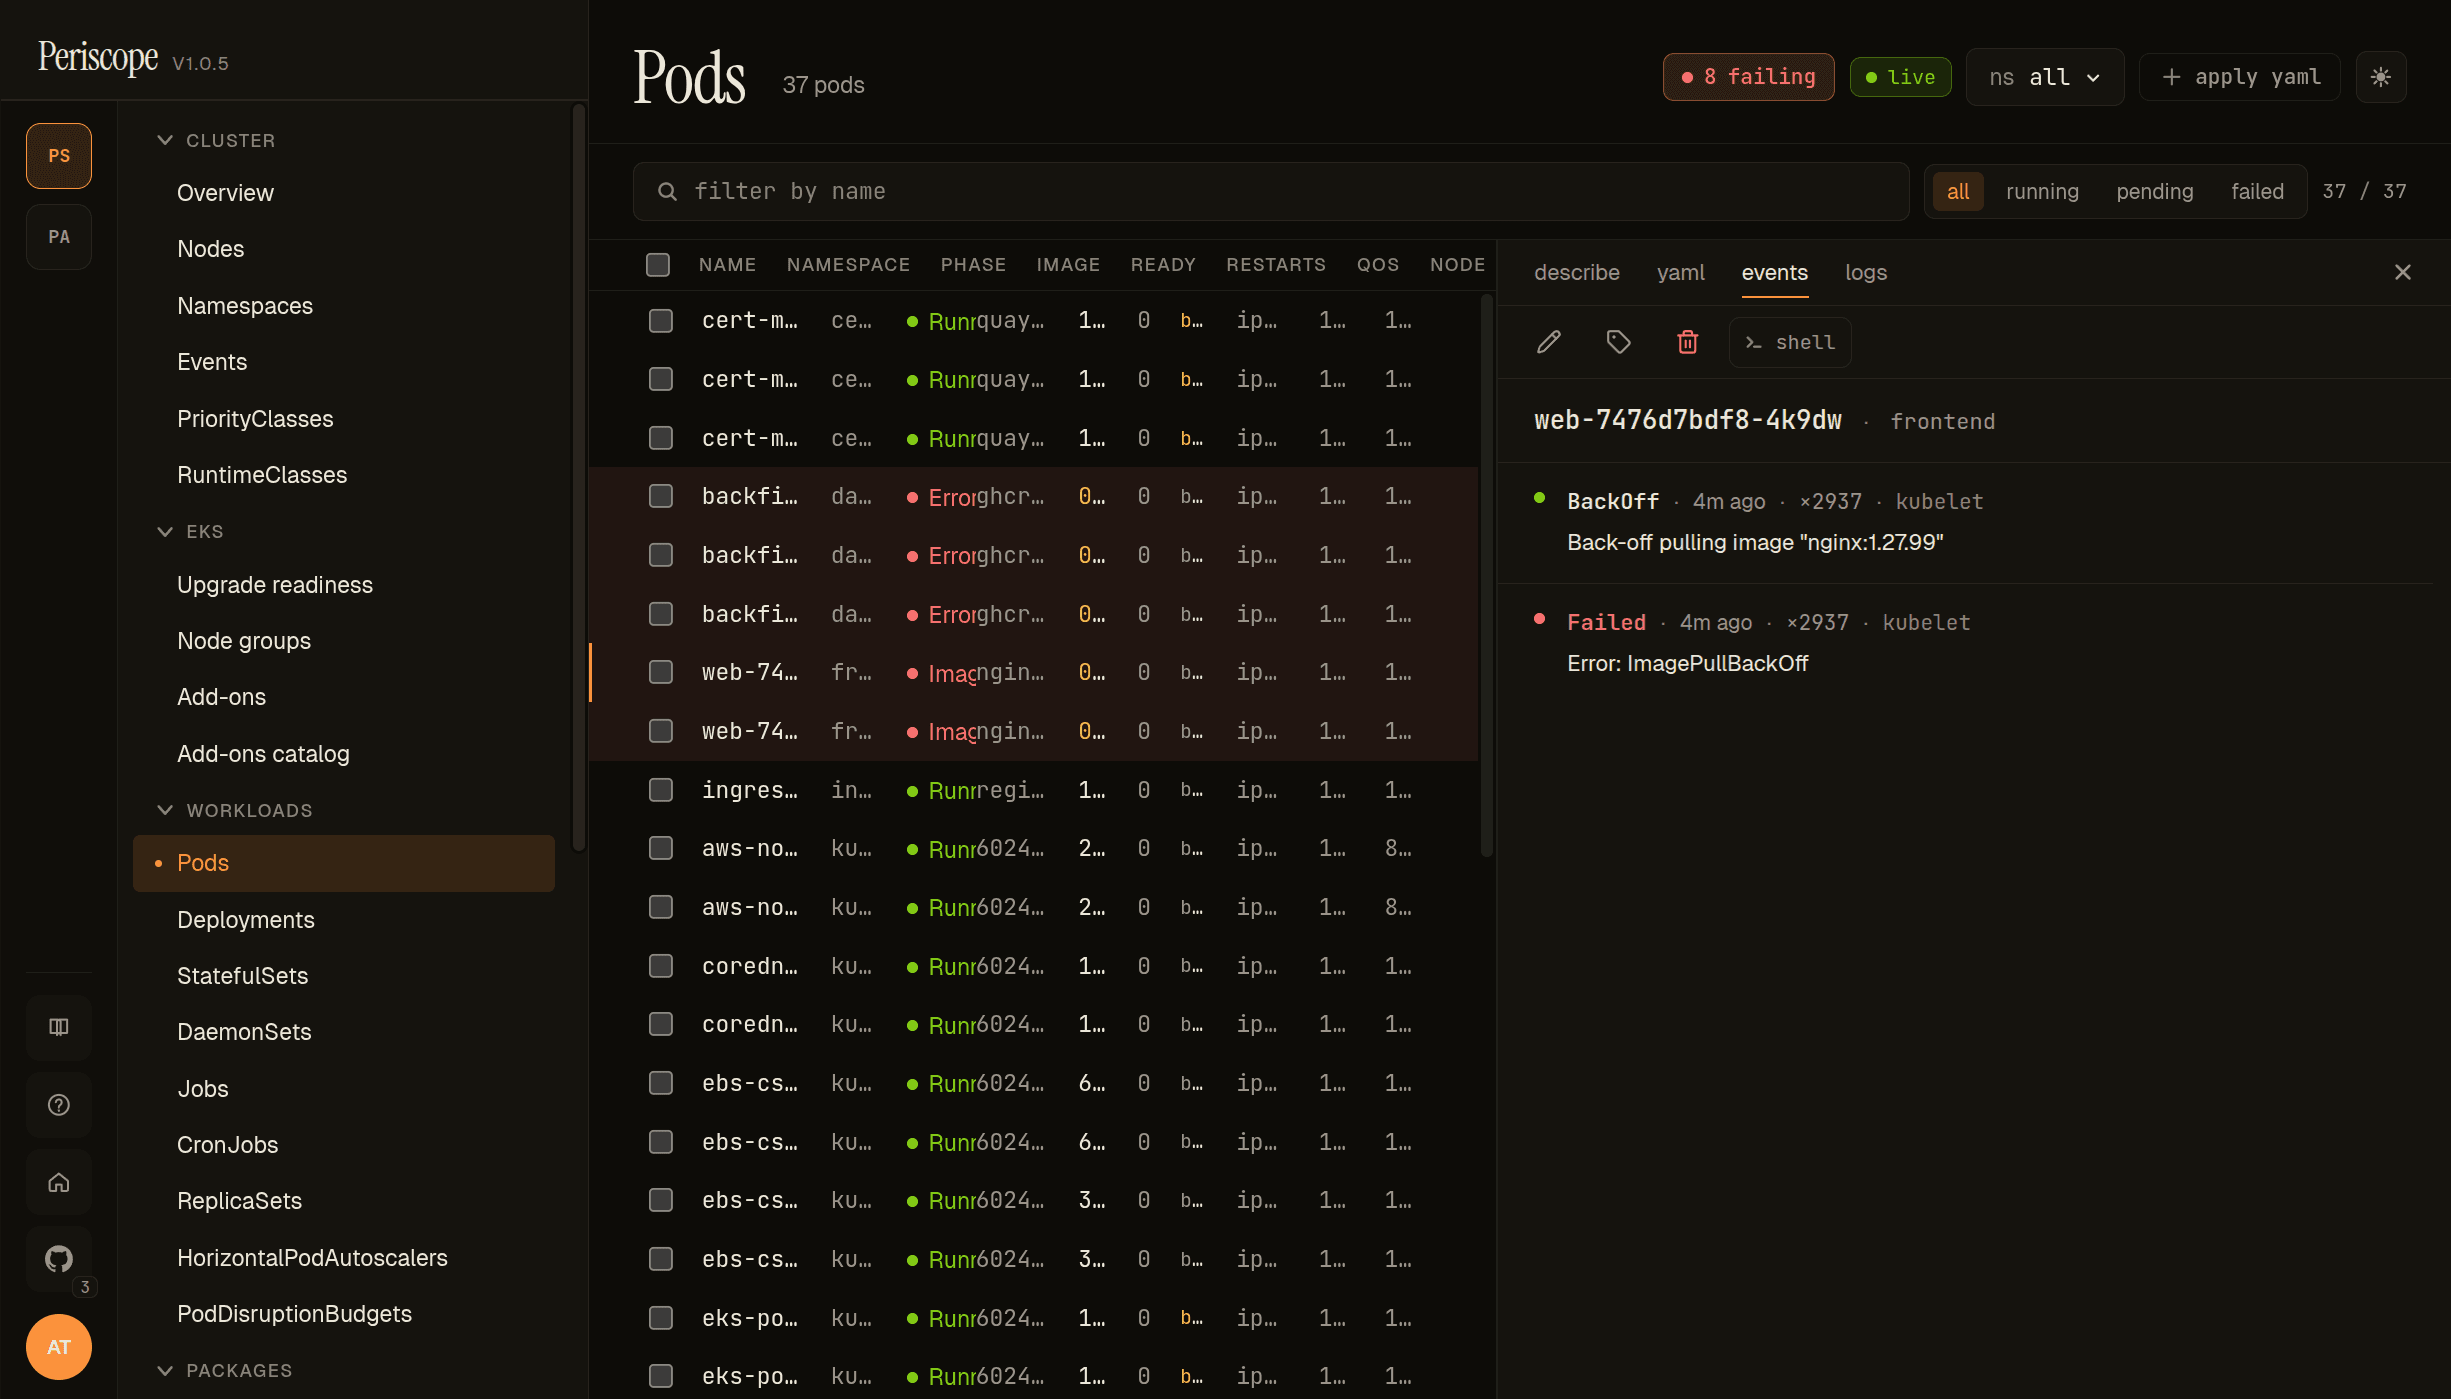
Events tab shows every K8s event with the pod as involvedObject,
newest first. Type pill (Normal / Warning — Warning rows tint
yellow), Reason, Message, Count, Source, Age.
The screencap above shows the failing web pod from the seeded frontend namespace — Back-off pulling image "nginx:1.27.99" and Error: ImagePullBackOff. The high Count value (× 2937 in the shot) is realistic for a pod that has been stuck in the BackOff loop for hours; kubelet collapses repeated pull attempts into one event with an incrementing counter. The events page carries the same shape across resources
(also see Cluster events for the
all-events feed).
Live logs
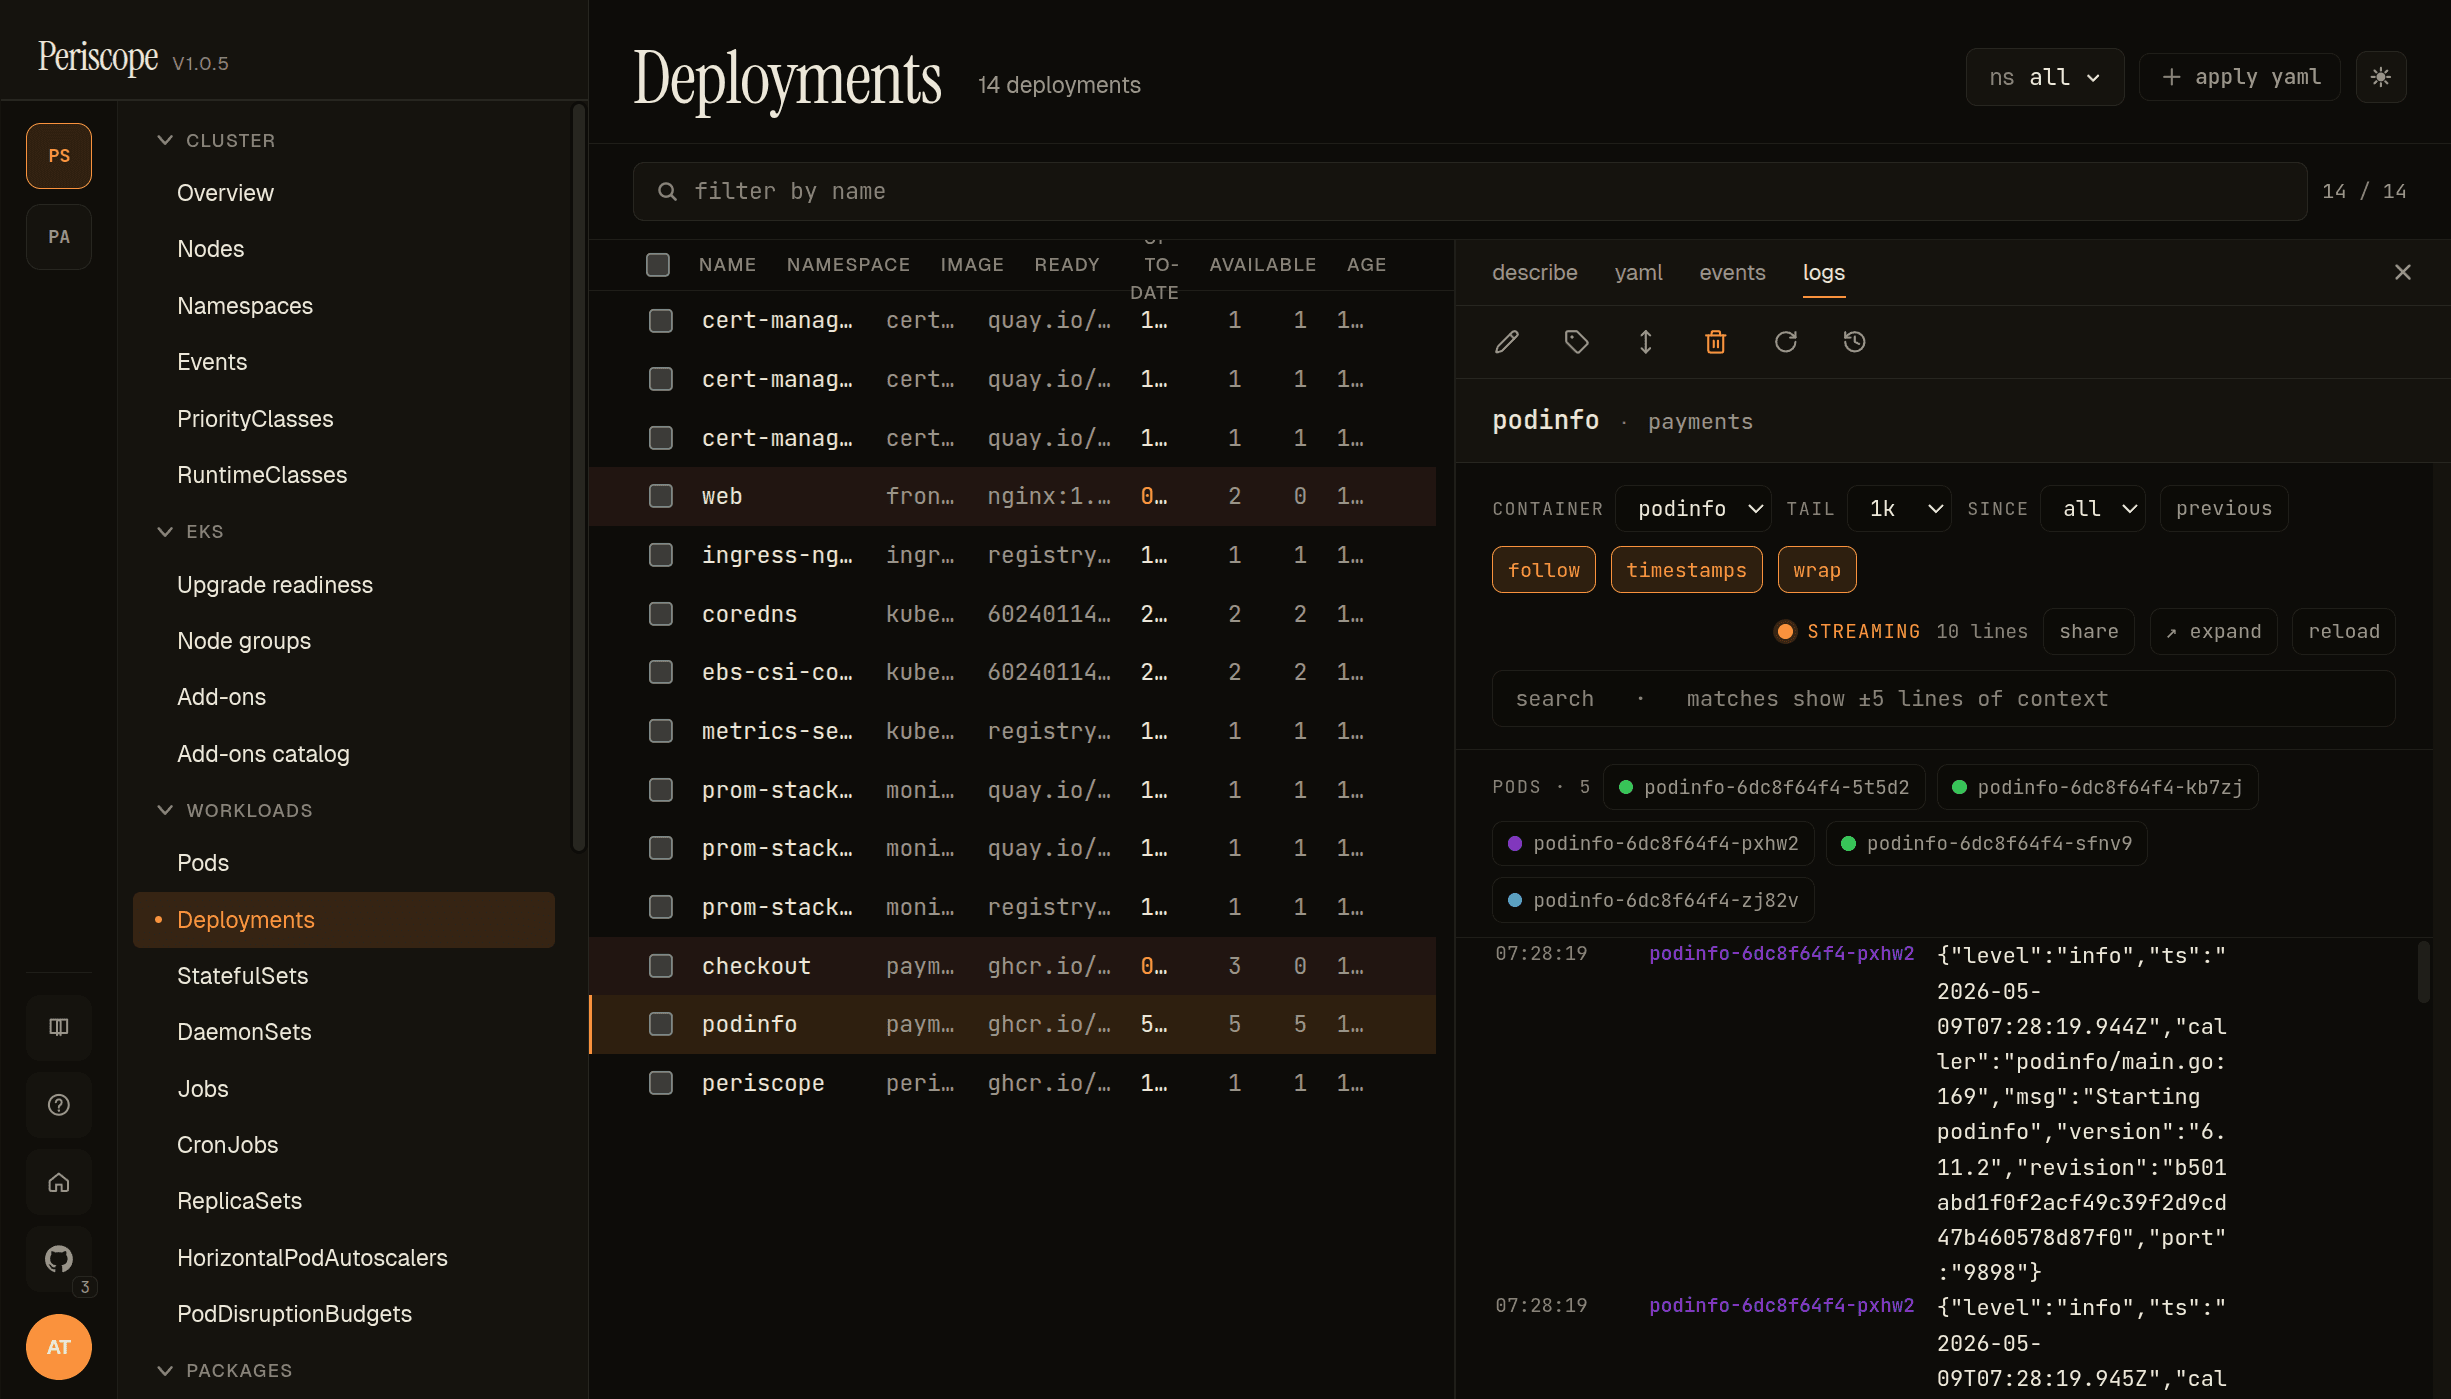
The Logs tab streams stdout + stderr from the kube-apiserver via SSE. The header strip carries:
- Container picker — for multi-container pods, switch which container's logs are streaming.
- Follow toggle — pause/resume the live stream. Auto-pauses when you scroll up to read history; click the toggle (or scroll to bottom) to resume.
- Search — filter visible lines by substring.
- Time range —
last N min,since pod start, custom. - Wrap toggle — on by default; off renders horizontally scrolling.
Expanded detail
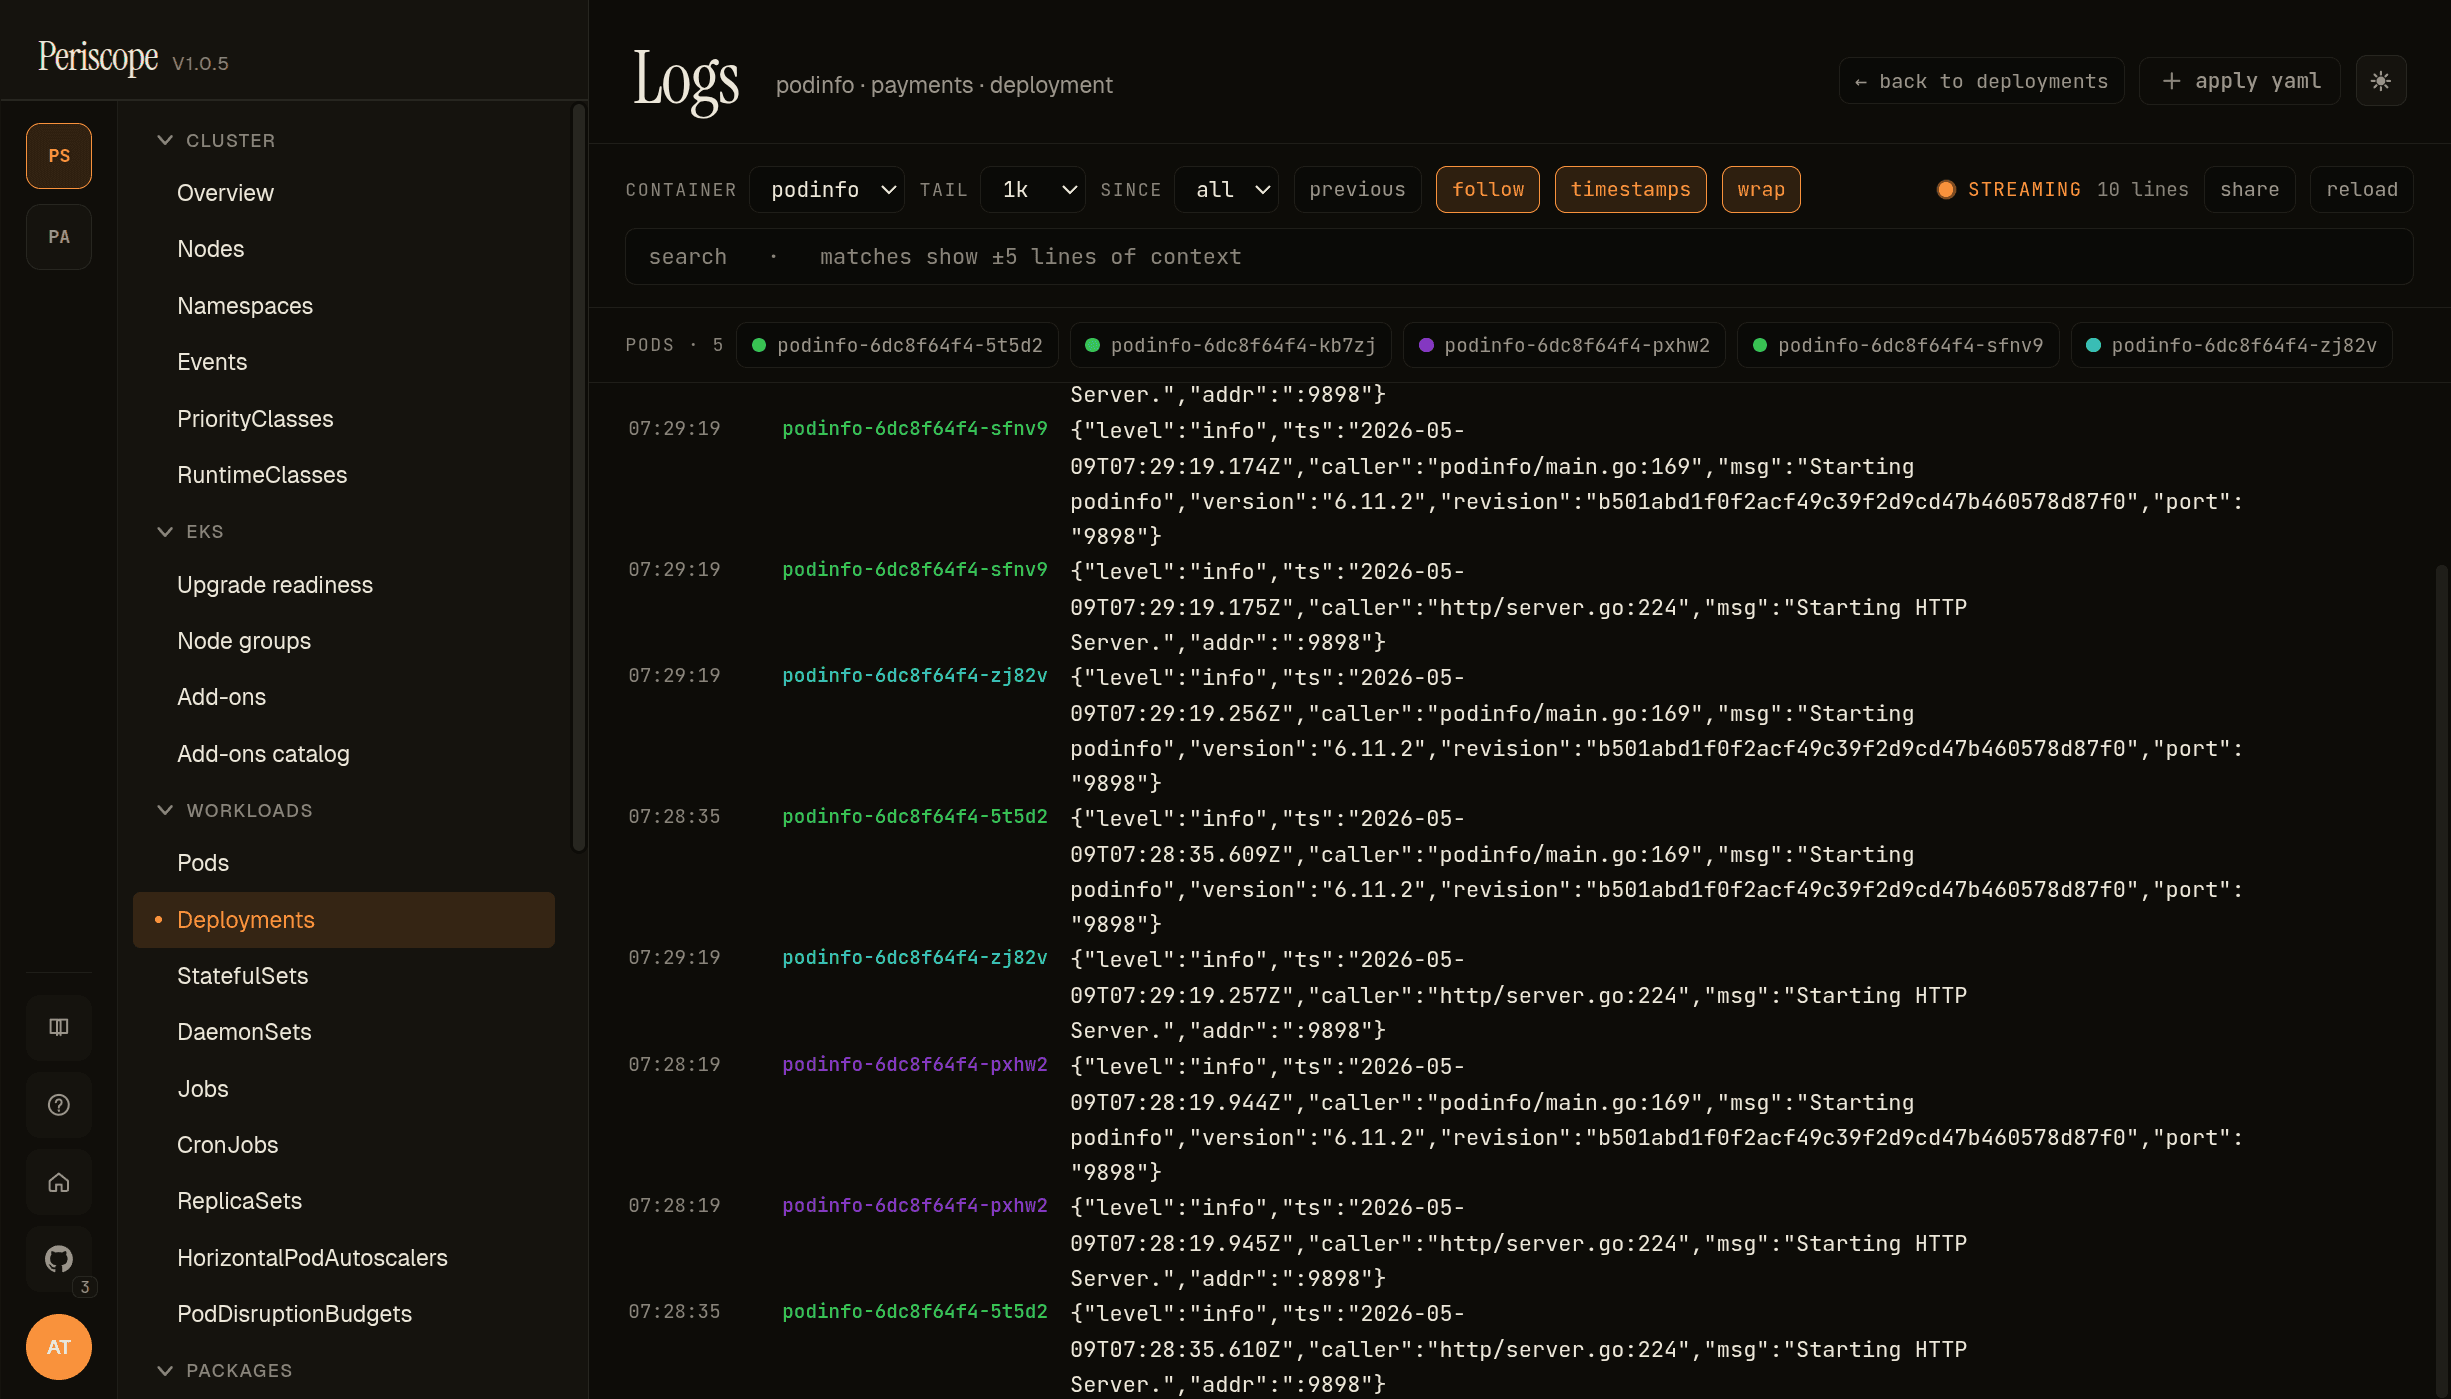
Click any log line to expand it. Structured-log lines (JSON, logfmt) get key-value previewed; plain text lines render verbatim. Useful when one line is wider than the viewport — the expanded view wraps cleanly.
Deployments list
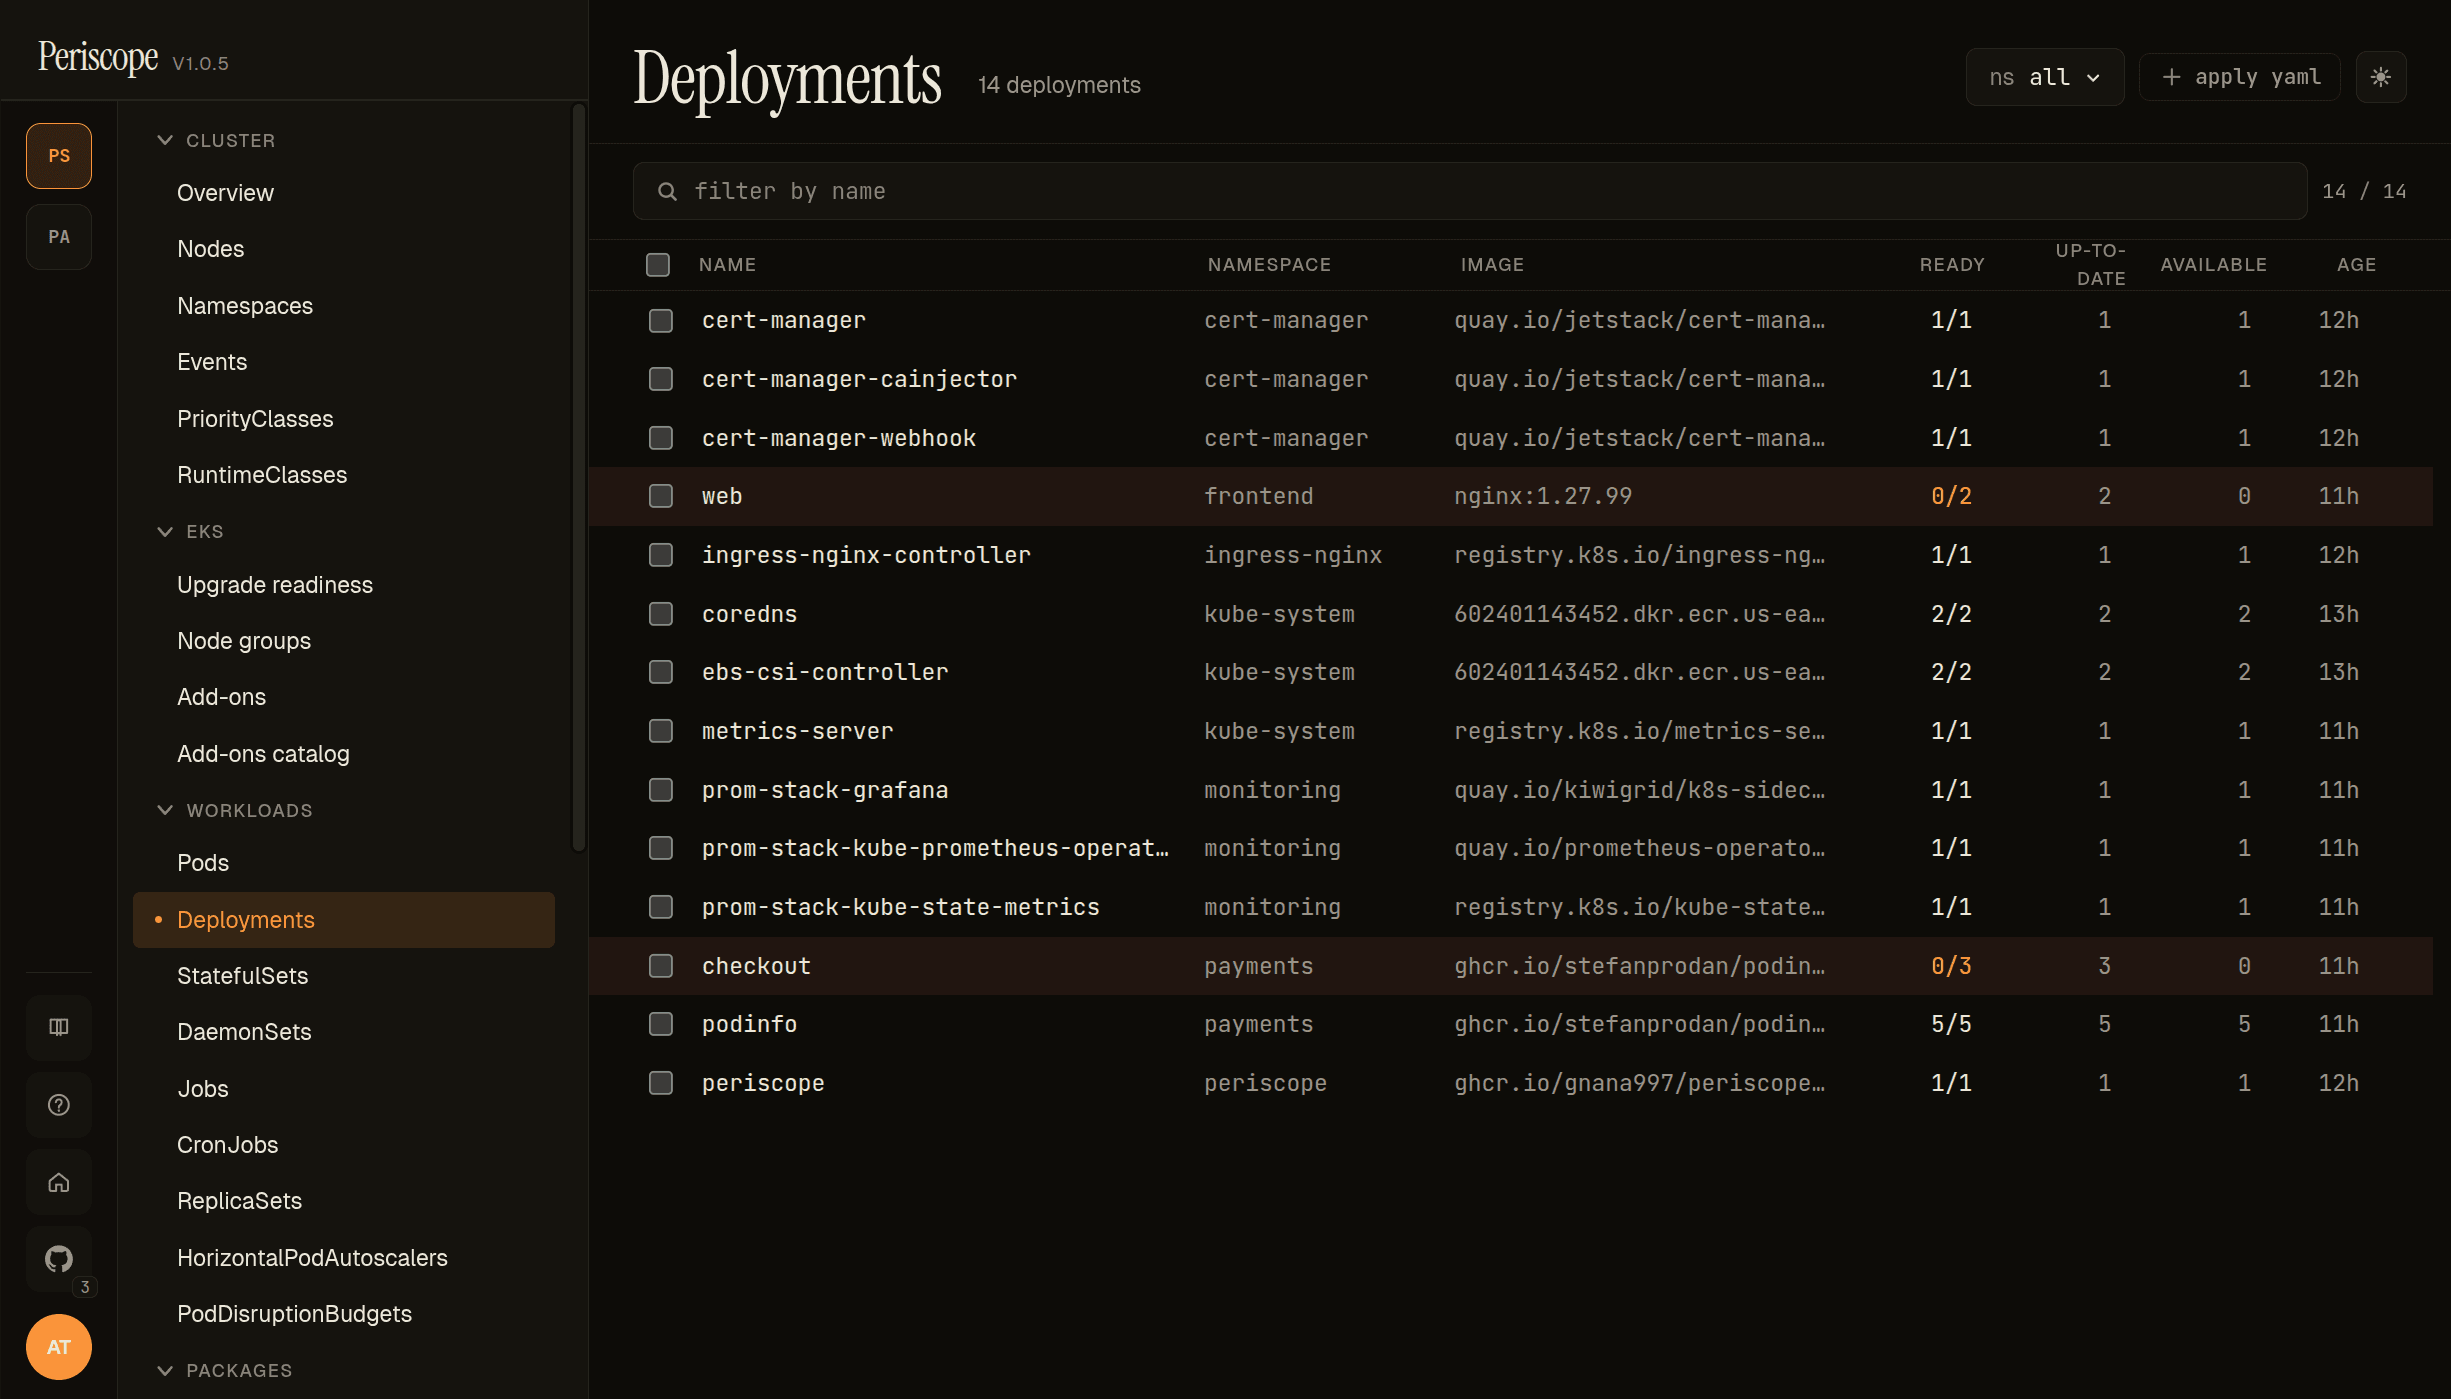
Same column shape as Pods, plus:
- Replicas — desired / current / ready / updated. Yellow tint when ready < desired, red when ready=0.
- Image — first container's image in the pod template.
- Strategy —
RollingUpdate(default) orRecreate. Surfaced on the detail tab; will move to the list in v1.1.
The detail pane mirrors Pods but with Replicas tab showing the
ReplicaSet history and a Rollback action that swaps to a prior
revision (see workload-rollback.md).
ReplicaSets
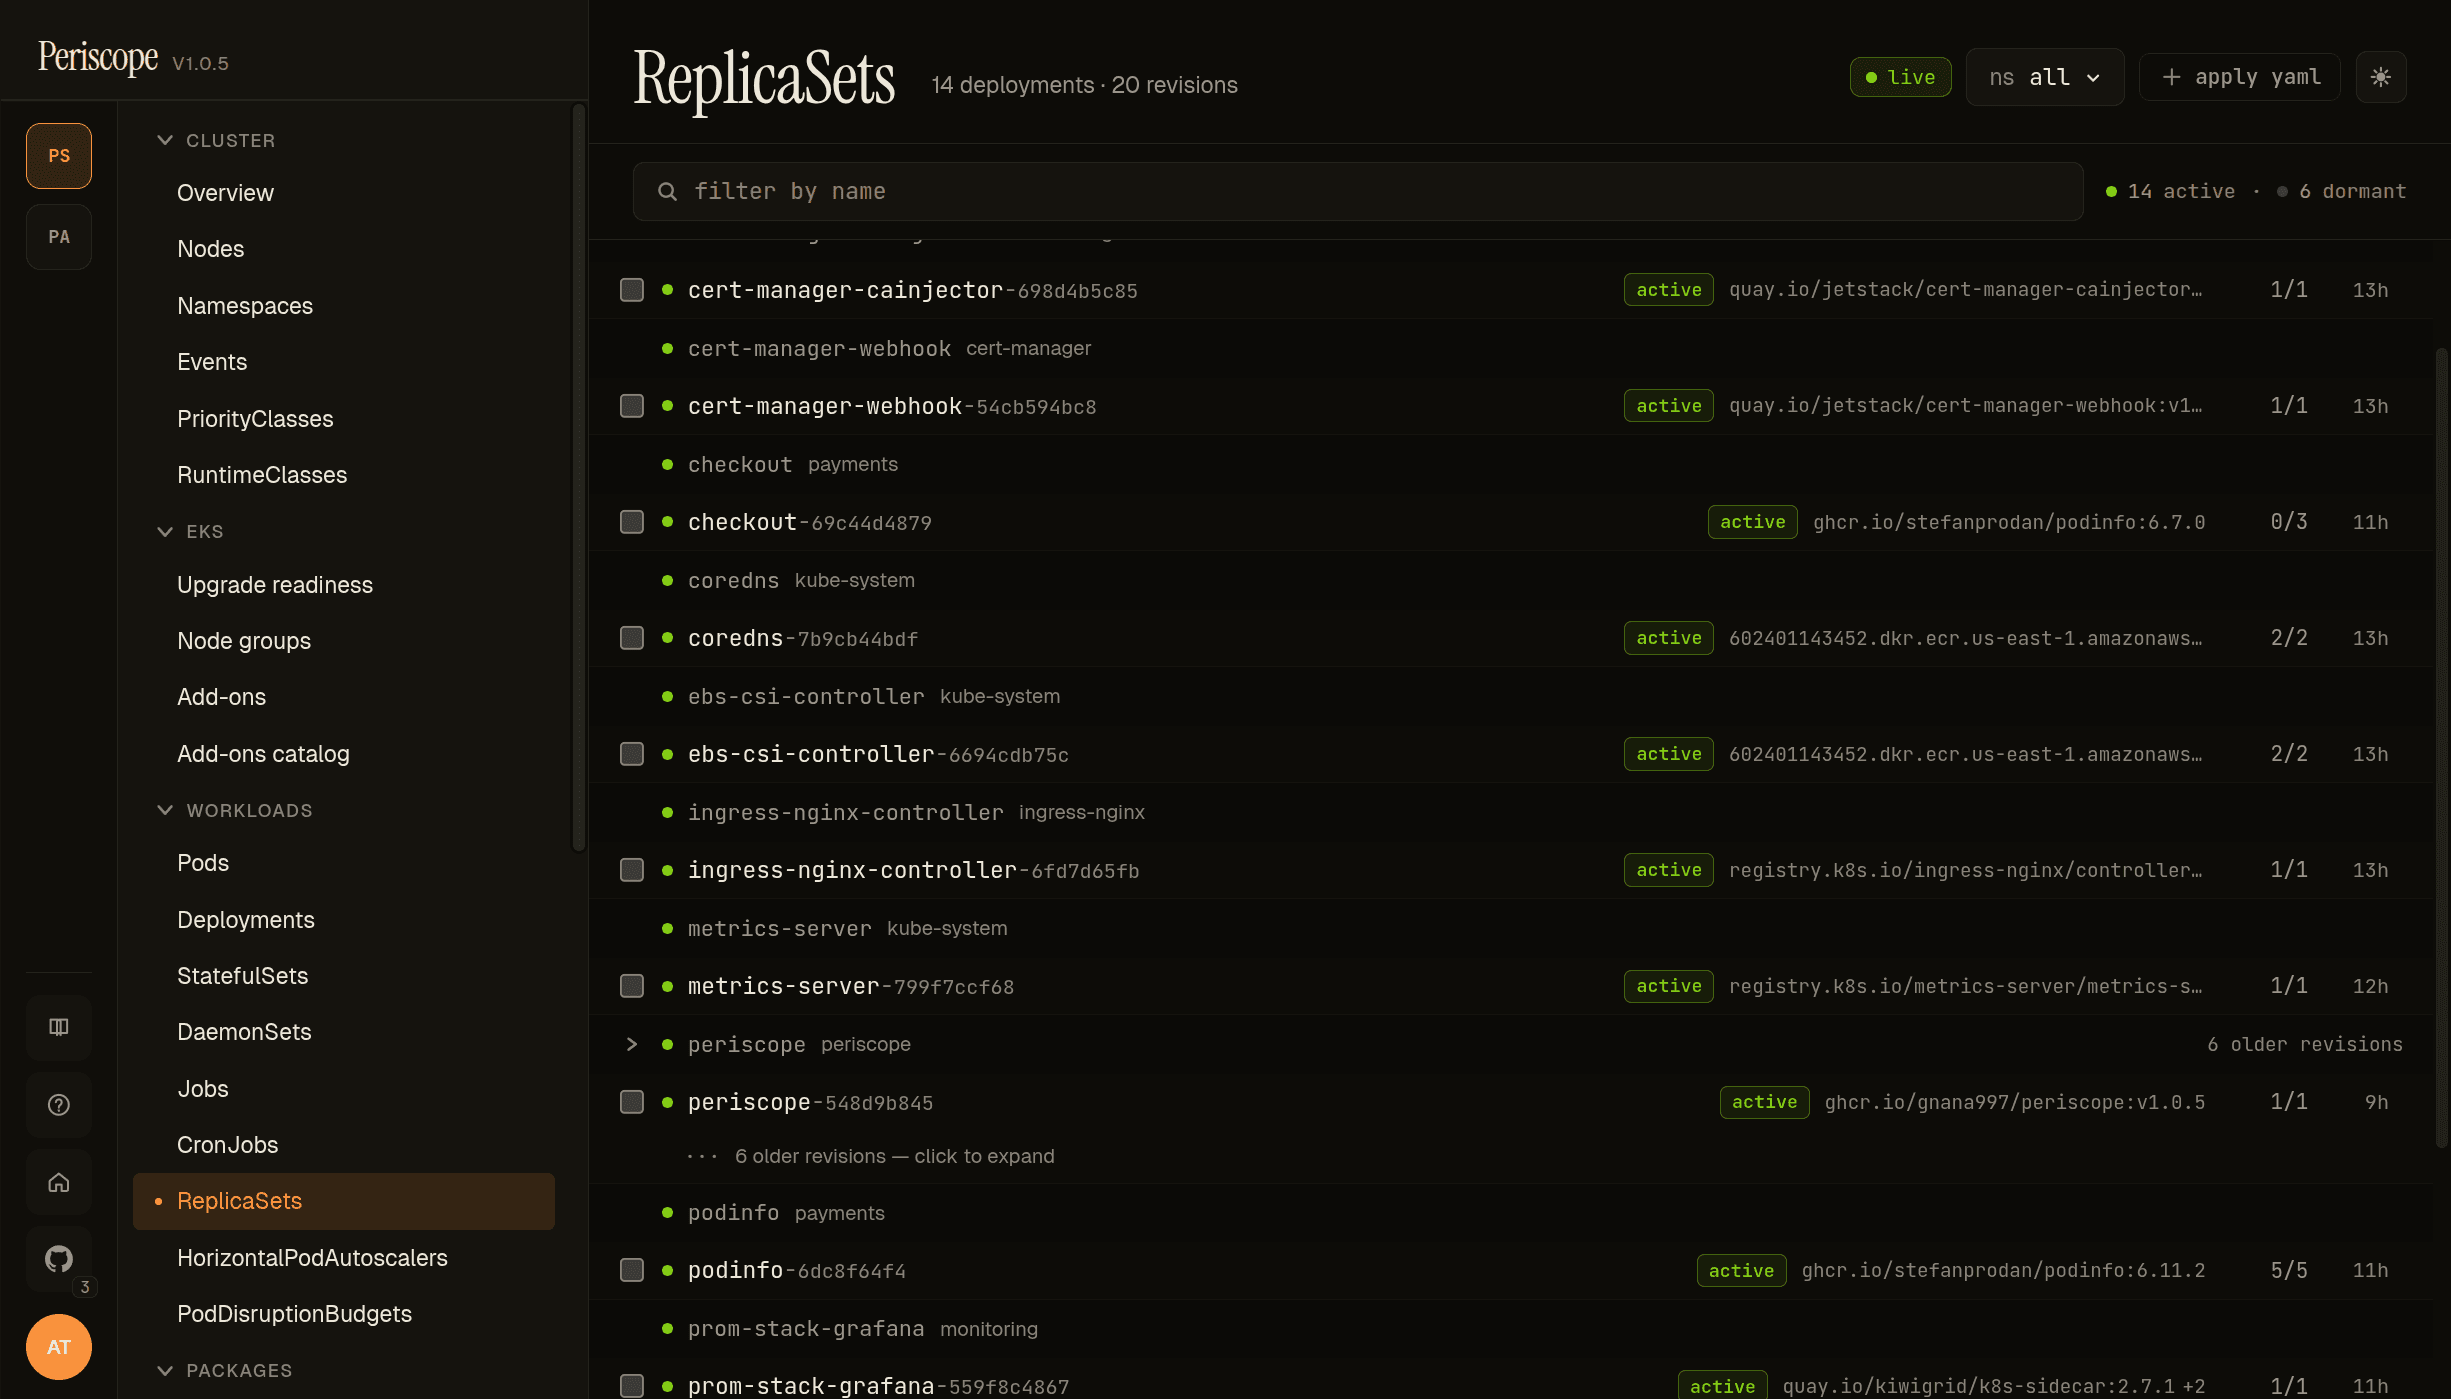
ReplicaSets get a custom layout instead of a flat table — they're grouped under their owning Deployment with the active RS shown by default and dormant historical revisions collapsed behind a + N older revisions — click to expand row. Distinguishes the operational signal (which RS is live; what's its image) from the historical archive (every prior rollout) without flooding the page.
Each row carries the active badge (green) when the RS has desired > 0, the container image (the column added in v1.0.5 — same shape as Pods + Deployments), and the READY/DESIRED counts. Standalone ReplicaSets (without a Deployment owner) get their own section at the bottom of the page.
The screencap above shows periscope with 6 older revisions collapsed — these correspond to the 7 helm revisions visible in the rollback dialog, one ReplicaSet per Deployment-template change. Click into any RS to see its detail (manifest, owned pods, events).
HorizontalPodAutoscalers
The HPA list page shows every autoscaling/v2 HorizontalPodAutoscaler in scope with these columns:
- NAME / NAMESPACE — the HPA itself.
- TARGET —
Kind/namereference (Deployment/podinfoin the screencap), pointing at what the HPA scales. - MIN / MAX — replica bounds from
spec.{minReplicas, maxReplicas}. - CURRENT / DESIRED — runtime state from
status.{currentReplicas, desiredReplicas}. - AGE — relative timestamp.
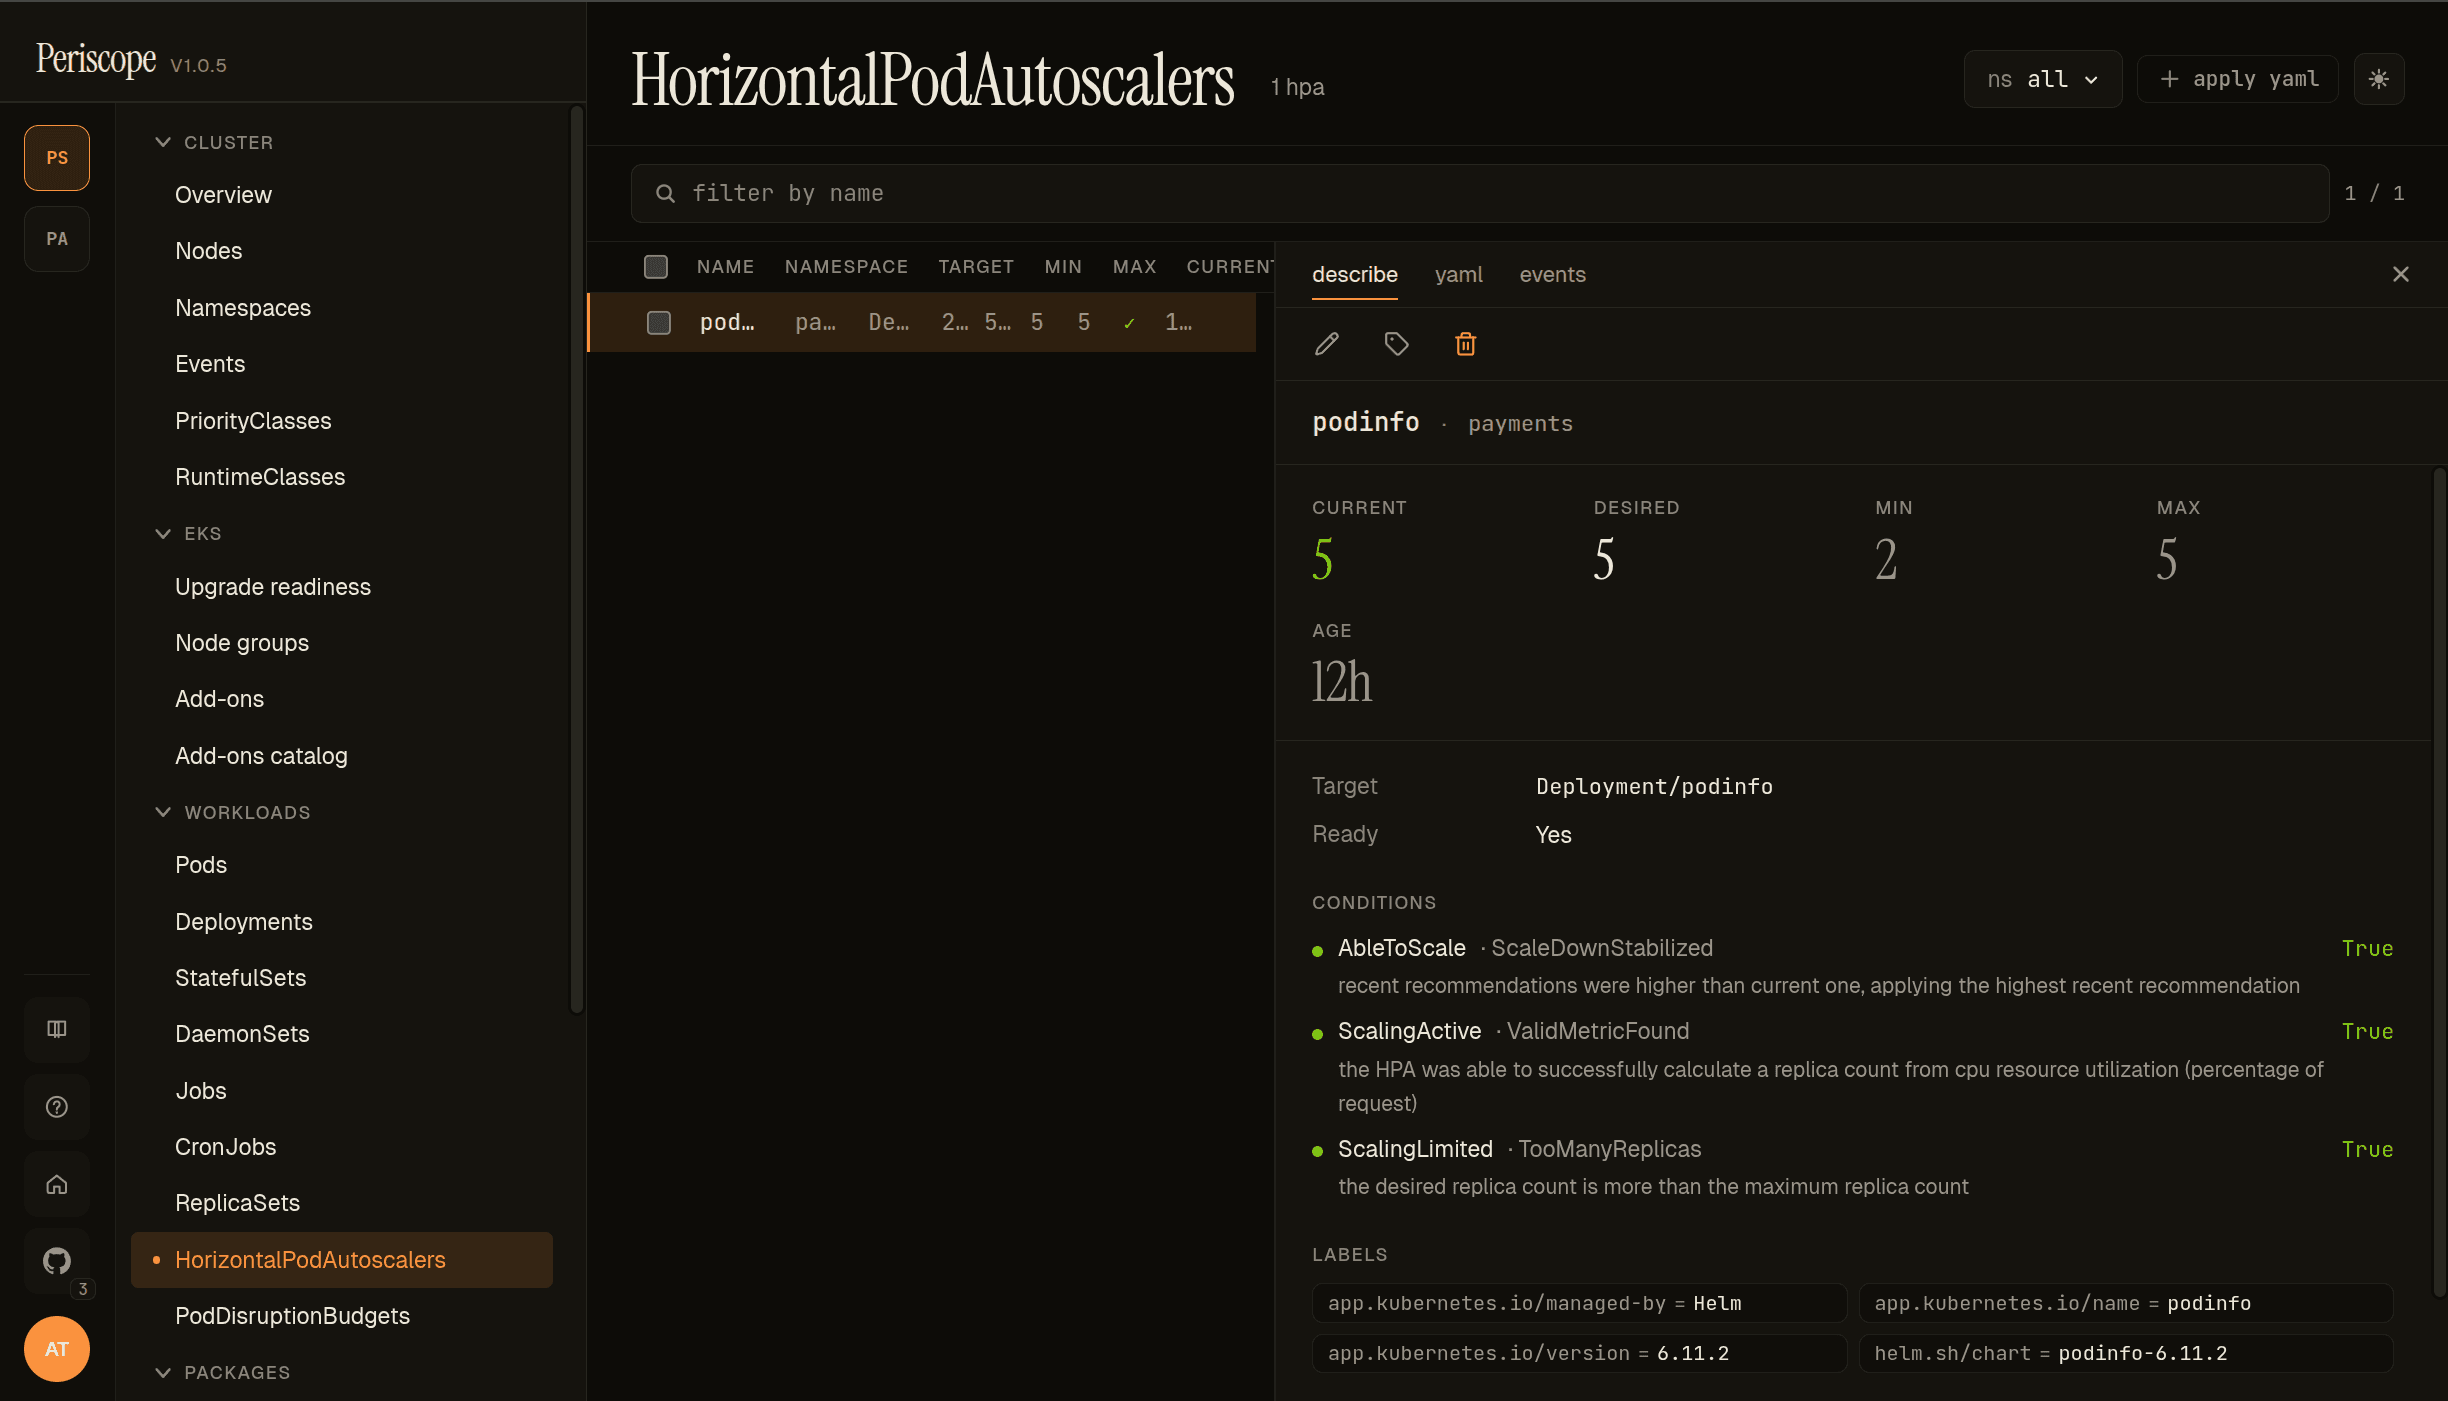
The detail pane's describe tab carries the runtime state cards (CURRENT / DESIRED / MIN / MAX), the Target + Ready chips, and the autoscaler conditions block — the operator-meaningful part.
The screencap above is the deliberately-overloaded podinfo HPA on peri-server's payments namespace: at 5/5/2/5 with three conditions reporting:
- AbleToScale =
True(ScaleDownStabilized) — recent recommendations were higher than current; HPA is applying the highest recommendation. - ScalingActive =
True(ValidMetricFound) — the HPA was able to successfully calculate a replica count from CPU resource utilization. - ScalingLimited =
True(TooManyReplicas) — the desired replica count is more than the maximum replica count.
ScalingLimited=TooManyReplicas is the canonical "your HPA wants to scale further but is capped" signal — usually the reason a paged-on-demand workload doesn't recover. Surfacing it on the describe tab without forcing the operator to dig through events is the point.
PodDisruptionBudgets
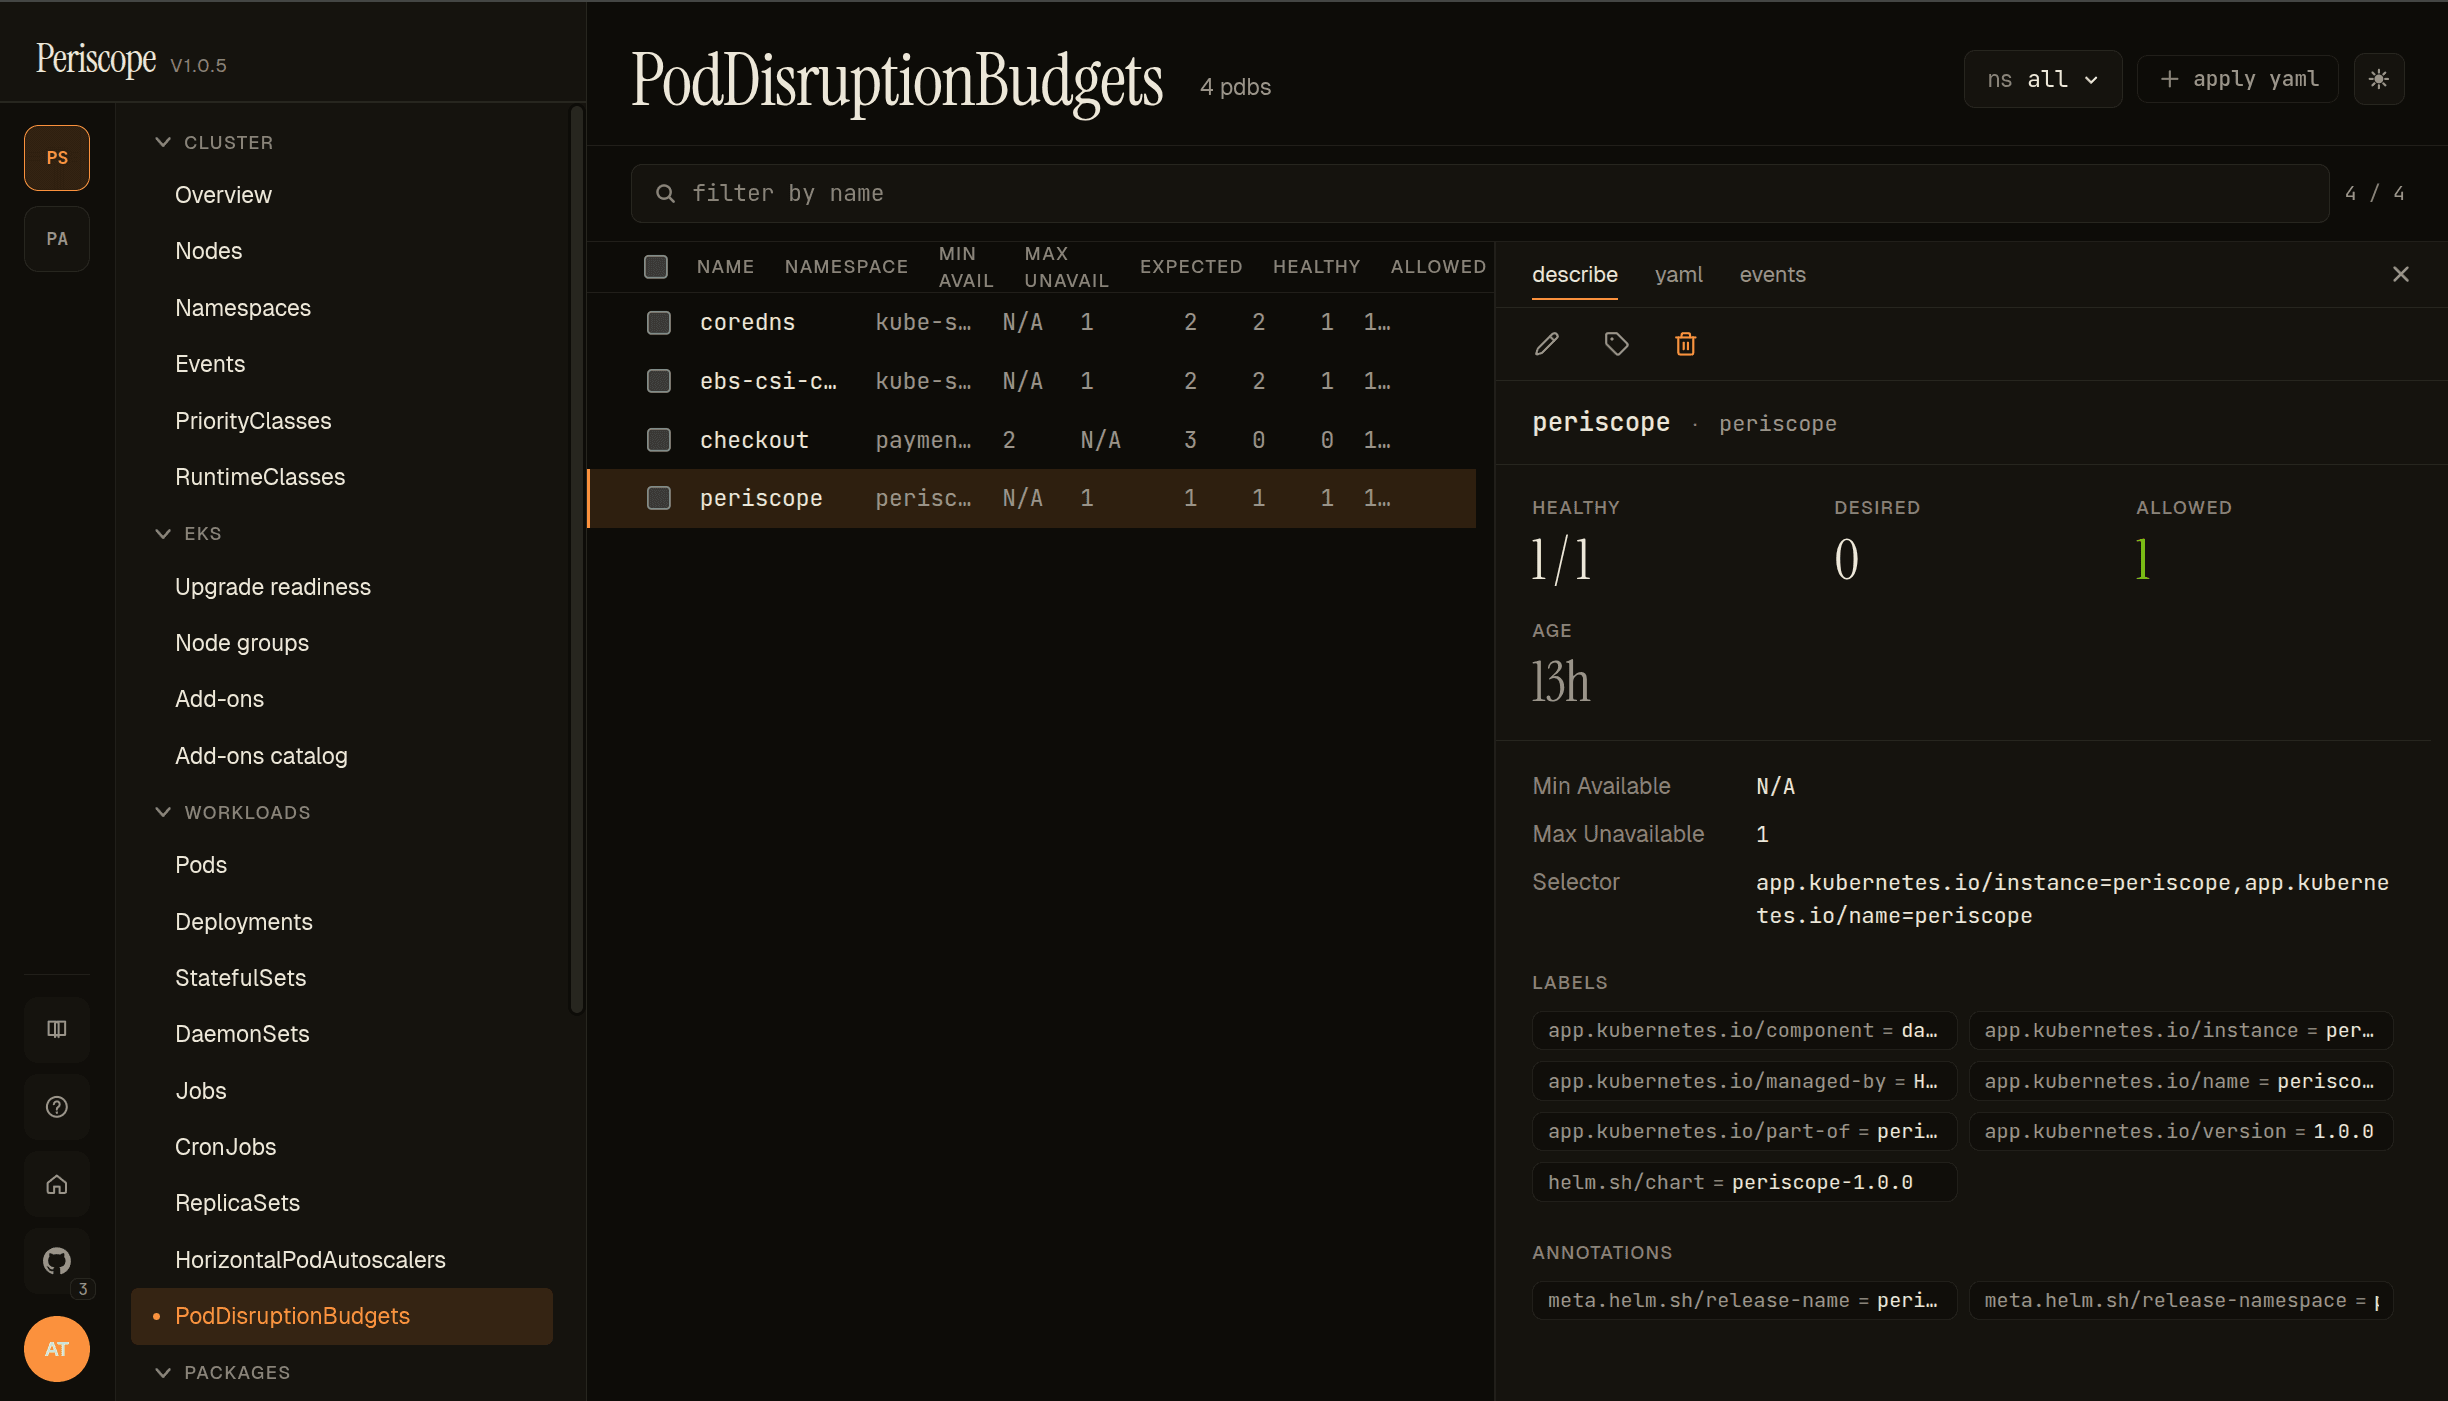
The PDB list page shows every policy/v1 PodDisruptionBudget with these columns:
- NAME / NAMESPACE — the PDB itself.
- MIN AVAIL / MAX UNAVAIL — the configured budget. Mutually exclusive — exactly one is set per PDB.
- EXPECTED / HEALTHY / ALLOWED — runtime state. ALLOWED is the headline number: how many additional disruptions the PDB will tolerate right now.
0means akubectl drainwill block.
The detail pane's describe tab carries the runtime cards (HEALTHY / DESIRED / ALLOWED), the budget config (Min Available / Max Unavailable), the pod Selector, and labels + annotations.
The screencap shows peri-server's 4-PDB set — coredns, ebs-csi-c…, checkout, periscope — with the periscope PDB selected: 1/1 healthy, 1 disruption allowed, Max Unavailable=1, selecting on the periscope-instance label.
Use this page during cluster maintenance windows: a quick scan of the ALLOWED column tells you which workloads will block a node drain before you start the drain.
RBAC
Each list page needs <kind>:list for the namespace scope (or
cluster-scoped for cross-namespace browsing). The events tab
additionally needs events:list in the involved-object's namespace.
Logs require pods/log:get — granted by the standard view
ClusterRole. Exec requires pods/exec:create, intentionally NOT
in view — granted by triage and above (see
cluster-rbac.md).
Related docs
cluster-overview.md— landing pageworkload-rollback.md— rollback flowpod-exec.md— Open Shellwatch-streams.md— the SSE plumbingstorage.md— PV + PVC pages reached from a Pod'sspec.volumescustom-resources.md— CRDs that own workloads viametadata.ownerReferencesthat makes these list pages live