Ask a Kubernetes cluster a follow-up to last week's question: which pods are using this GPU right now, when four of them are sharing it? The NVIDIA stack has a clean answer for one-pod-per-GPU. Once MPS (Multi-Process Service) is on and four pods hold nvidia.com/gpu: 1 on the same physical device, the stack quietly stops telling the truth.
Every five seconds the DCGM exporter's pod-attributed GPU utilization metric returns exactly one row. That row credits one tenant with the device's entire utilization figure and zero to the other three. The pod it credits flips between scrapes. A pod can drive a continuous CUDA workload for the entire window and be credited zero times. The allocation layer (kubectl get pods, the kubelet's own records) knows the truth: four pods hold a slot. The telemetry layer reports it as one.
That breaks the (node, UUID, pod) join the last post framed Periscope Milestone 2 around. The pod label is unreliable under MPS, not because of a bug in DCGM, but because the device-level telemetry layer has no concept of multi-tenant sharing. What follows is the experiment that produced the misattribution, the mechanism that explains it, the related case (pod churn) that turned out not to break the join at all, and the rule a Kubernetes GPU view has to absorb from both.
Reproducibility. Same rig as the first lab: microk8s on Ubuntu with microk8s enable dns gpu, the NVIDIA GPU Operator deployed into gpu-operator-resources, single RTX 4060 Laptop GPU. The MPS half adds one ConfigMap (device-plugin-config with sharing.mps.replicas: 4) and a ClusterPolicy patch pointing the device plugin at it; the operator restarts the device plugin and the node re-advertises the GPU as four schedulable replicas. The four tenant Deployments are identical except for name, each running a continuous CUDA kernel. The churn experiment is kubectl delete pod issued mid-window against a GPU-bound Deployment while a 5-second scrape loop runs against the DCGM exporter. No cloud spend, no special hardware.
MPS sharing, as Kubernetes sees it
The setup is two YAML changes and a wait. The device-plugin sharing config declares mps with replicas: 4. The Operator restarts the device plugin, GFD relabels the node, and the node now advertises four allocatable units of nvidia.com/gpu backed by one physical device. Periscope reads the new posture straight off the node labels:
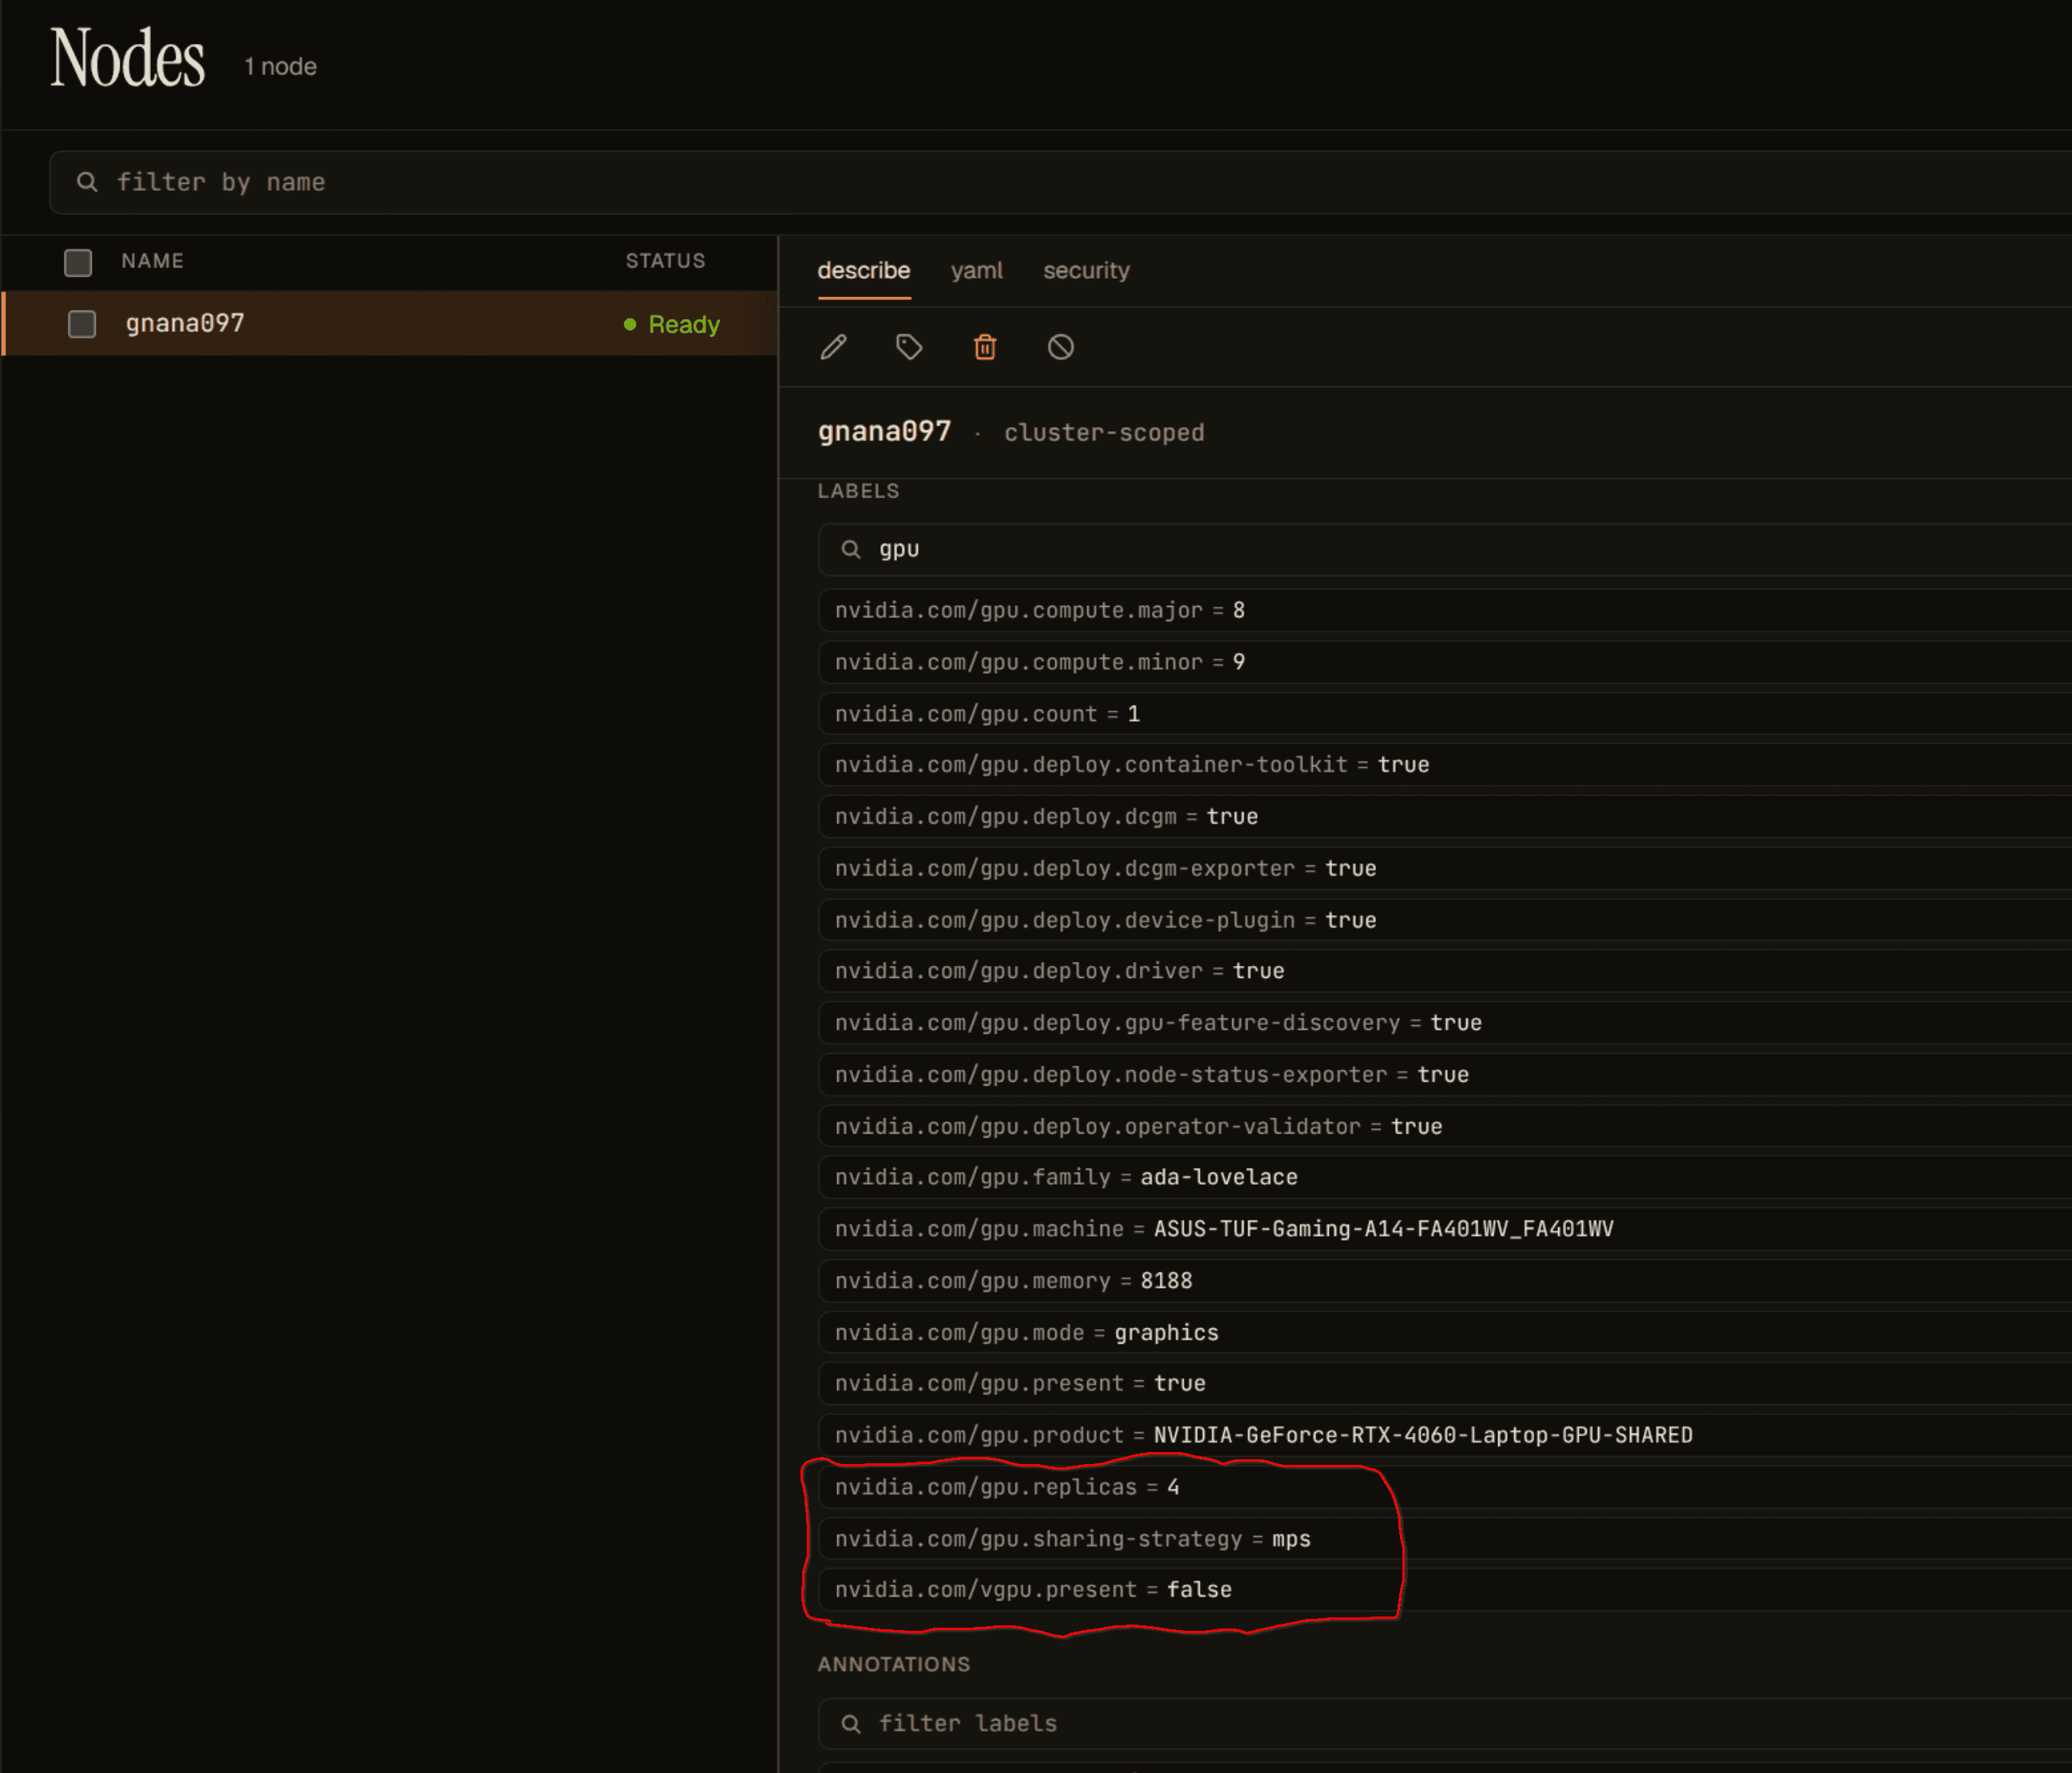
Three labels matter. nvidia.com/gpu.replicas: 4, nvidia.com/gpu.sharing-strategy: mps, and the product label NVIDIA-GeForce-RTX-4060-Laptop-GPU-SHARED. The Operator appends -SHARED whenever a sharing strategy is active, which is a useful, queryable hint that the device is no longer one-pod-per-GPU. Four pods (mps-tenant-a through -d), each requesting nvidia.com/gpu: 1 and each running a continuous CUDA workload, schedule onto those four slots.
All four reach Running and stay there. The kubelet's own status records the allocation precisely:
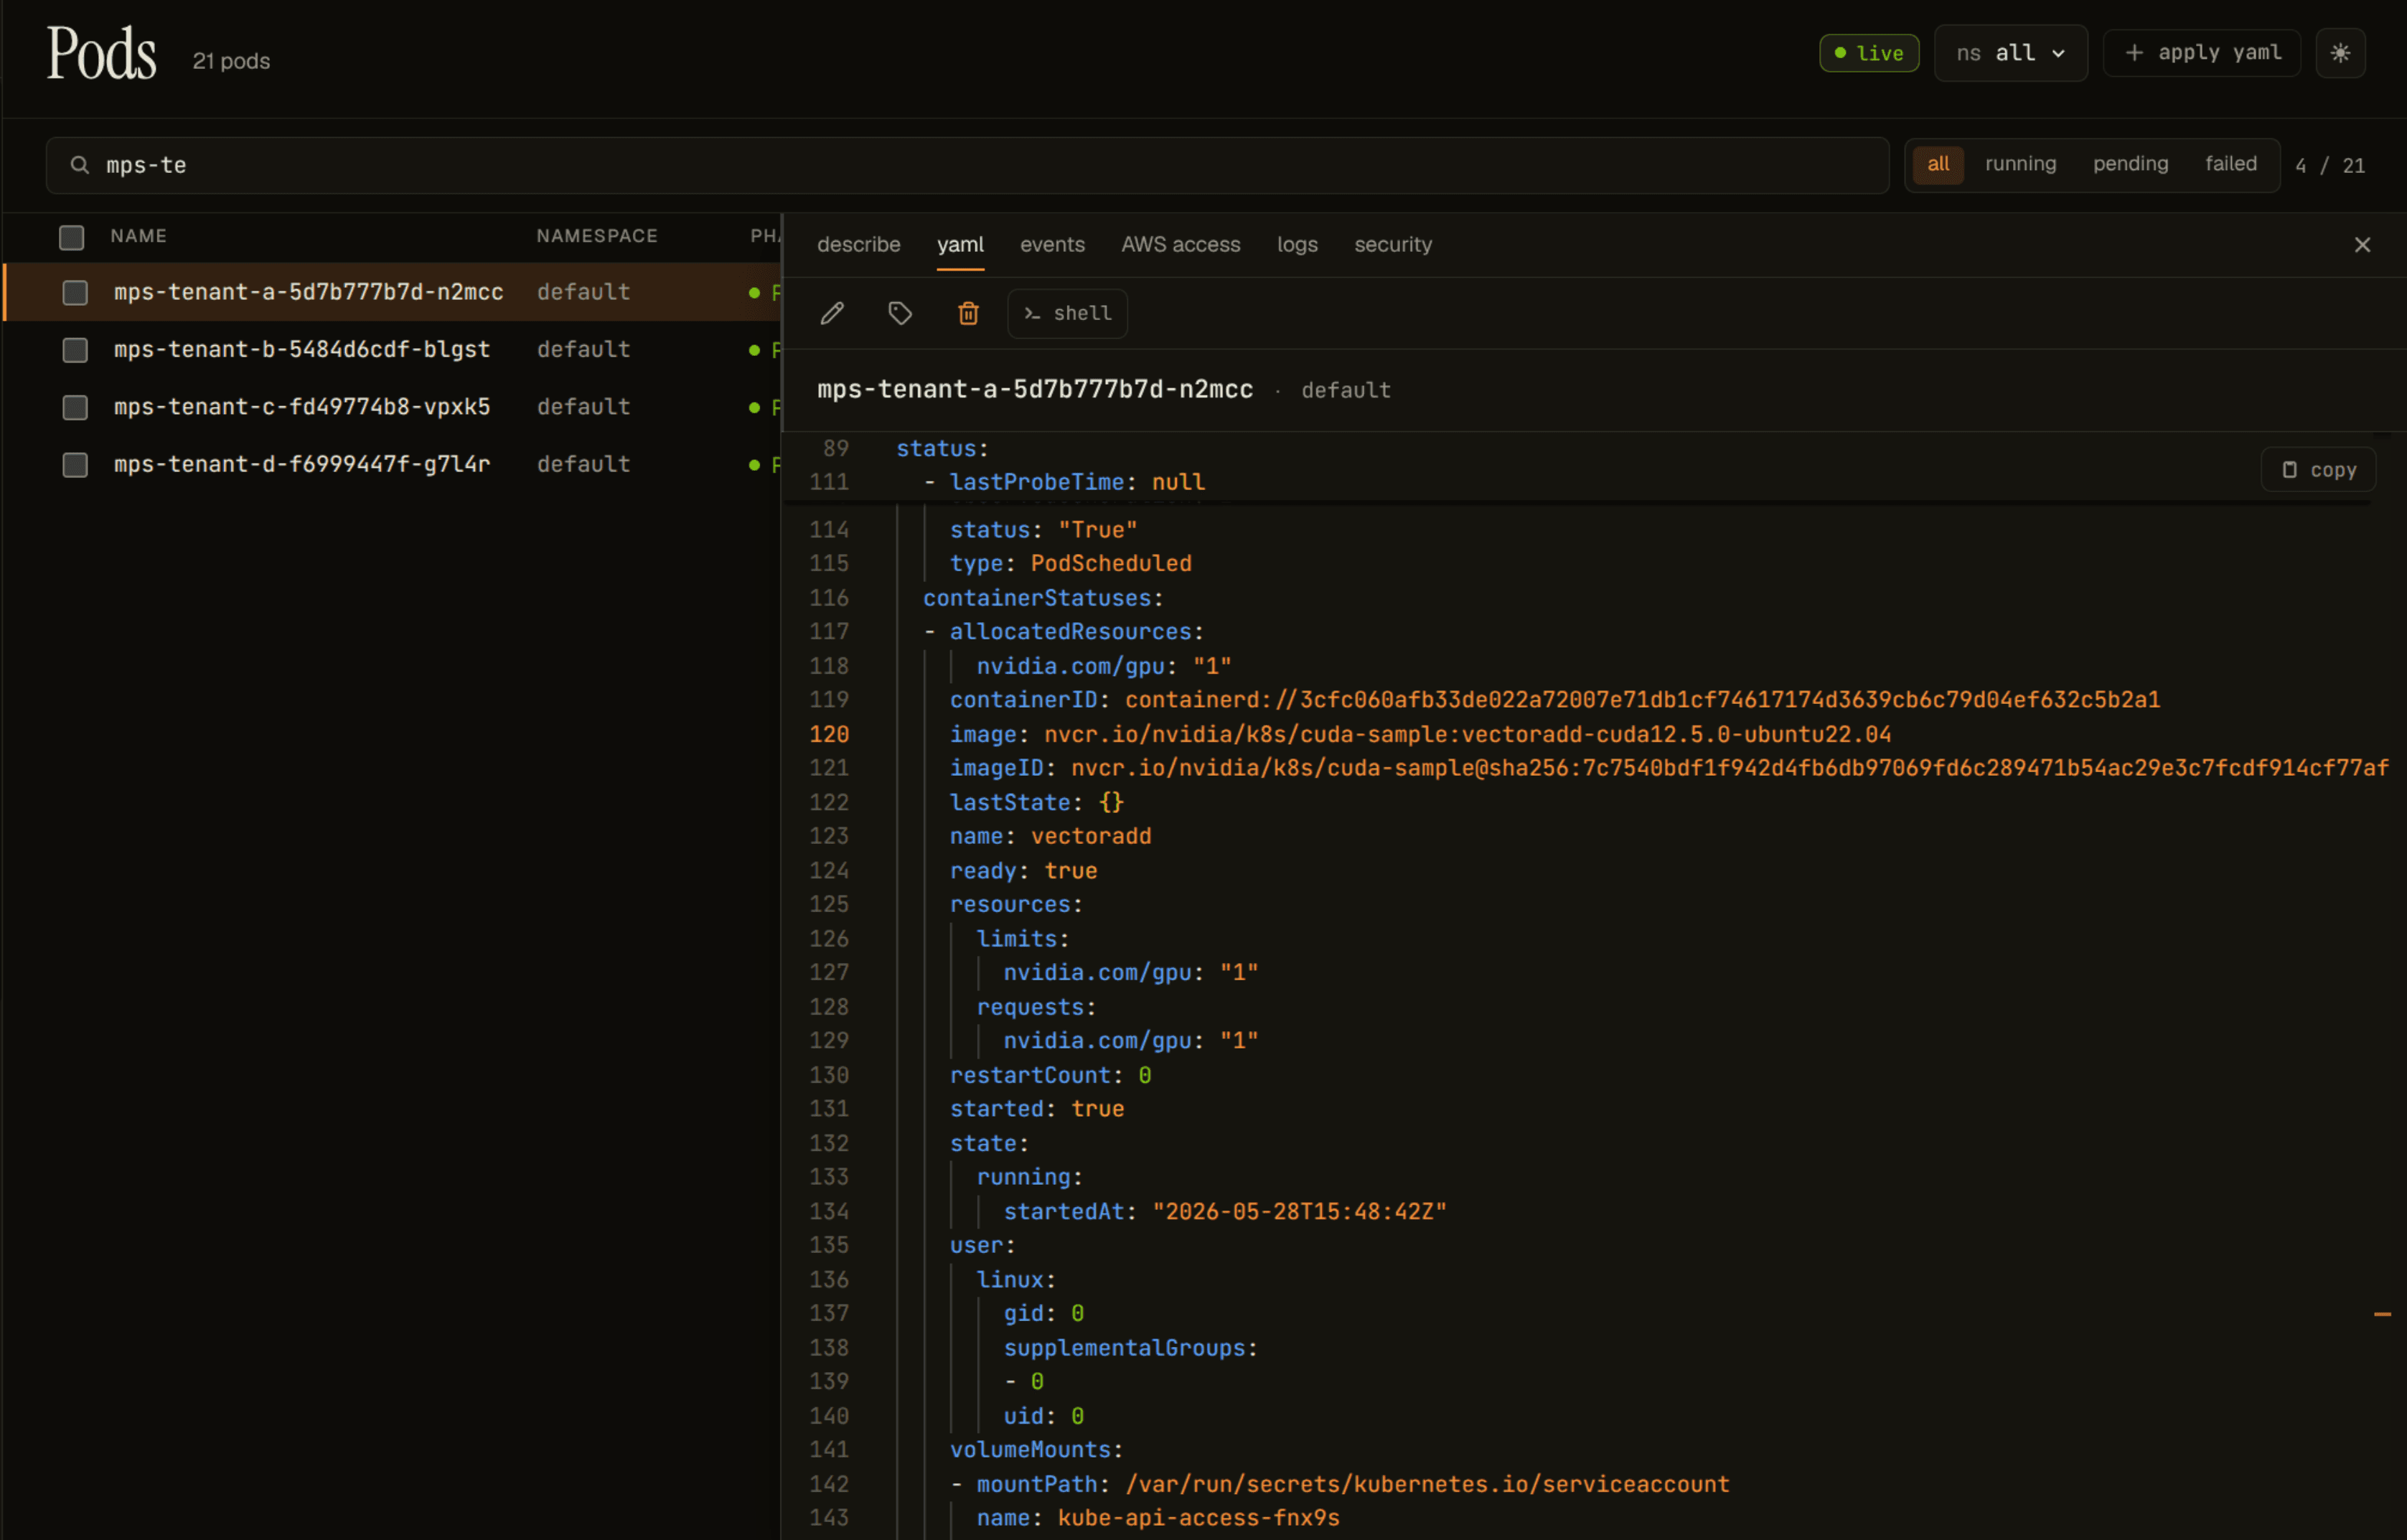
Four pods, four nvidia.com/gpu: 1 allocations, every one of them Running. That is the truth as Kubernetes records it. Hold onto that. It is the truth the telemetry layer is about to contradict.
The misattribution
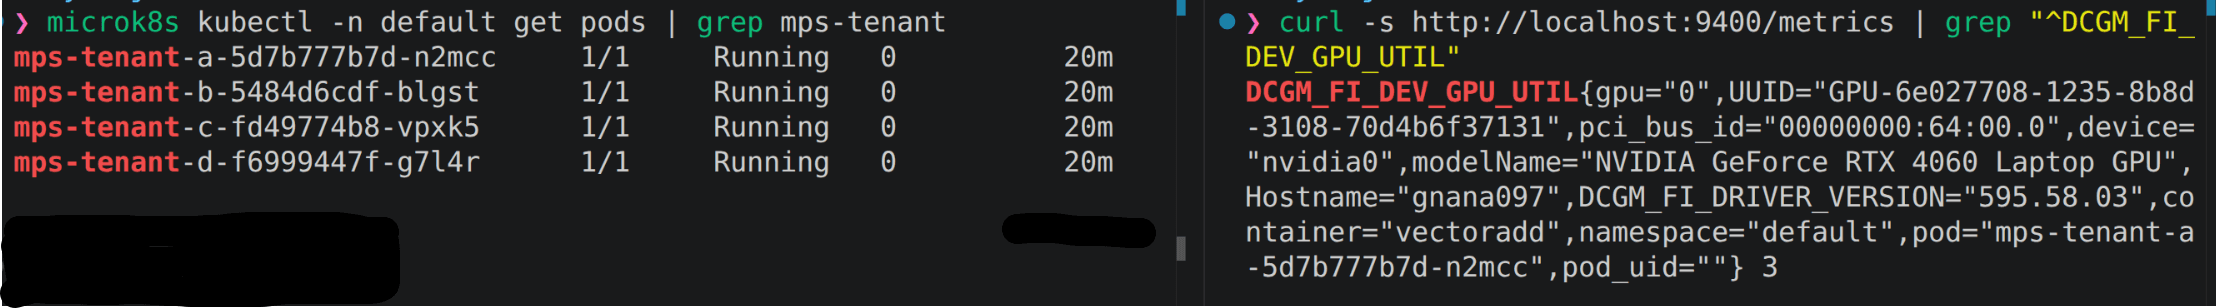
Scraping DCGM_FI_DEV_GPU_UTIL against the same node, every five seconds, produces exactly one row per scrape. The entire metric output at each scrape instant is a single line naming one pod, not four lines one per tenant. The pod that single line credits is not the same pod twice in a row. Each row in the table below is one scrape moment; the Credited pod column is whichever pod's name DCGM stamped on that scrape's single line:
| Time | Credited pod | util % |
|---|---|---|
| 21:23:12 | mps-tenant-b | 8 |
| 21:23:27 | mps-tenant-b | 6 |
| 21:23:42 | mps-tenant-c | 6 |
| 21:23:57 | mps-tenant-a | 9 |
| 21:24:12 | mps-tenant-c | 9 |
| 21:24:27 | mps-tenant-b | 6 |
| 21:24:42 | mps-tenant-b | 6 |
| 21:24:57 | mps-tenant-a | 5 |
| 21:25:12 | mps-tenant-a | 5 |
| 21:25:27 | mps-tenant-a | 6 |
| 21:25:42 | mps-tenant-b | 6 |
| 21:25:57 | mps-tenant-c | 6 |
Twelve consecutive scrapes, all four pods running the whole time. The credit distribution:
| Tenant | Times credited |
|---|---|
| mps-tenant-a | 4 |
| mps-tenant-b | 5 |
| mps-tenant-c | 3 |
| mps-tenant-d | 0 |
Read the last row again. mps-tenant-d ran a continuous GPU workload for the entire window and DCGM's pod-attributed utilization credited it exactly zero times. Every scrape attributes 100% of the GPU's utilization to one tenant and 0% to the other three; the tenant that wins is non-deterministic; one tenant can be invisible to the metric for the full window. A second run produced a different distribution with a different "winner" and the same broken shape: one credited, others zero, no aggregation.
A dashboard built on this metric, in good faith, would draw four time series (three of them rising and falling, one flat at zero) and look completely plausible. The tenant at zero is not idle. The metric is.
Why DCGM cannot tell the tenants apart
Look at the process tree on the node:
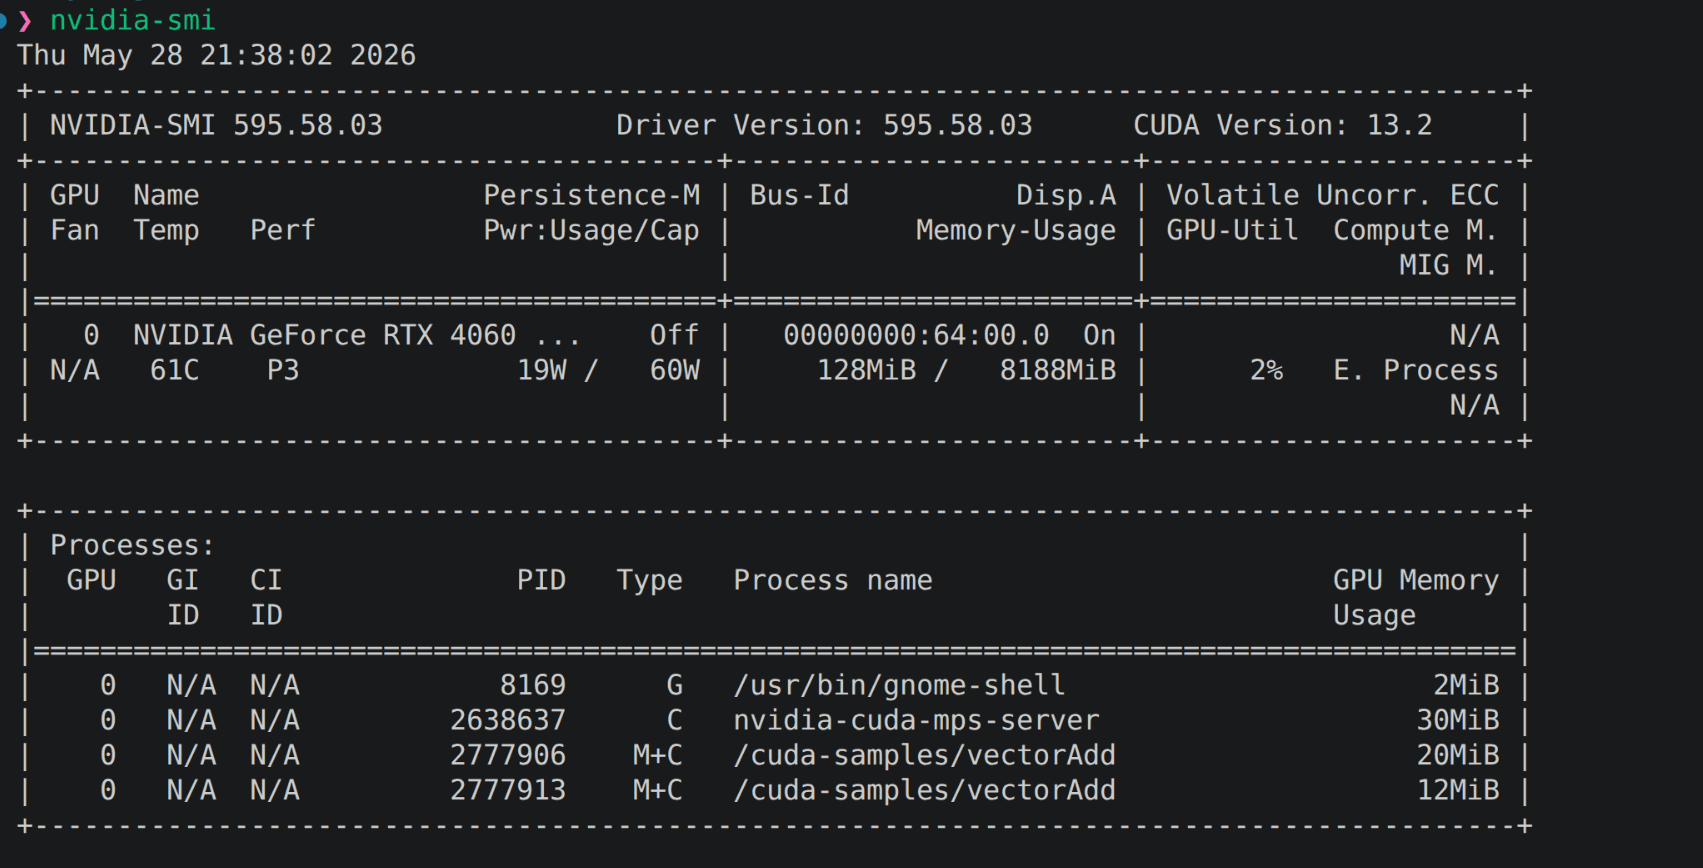
Look at the Type column: the four vectorAdd rows are tagged M+C, not the plain C a native CUDA process carries. The M is the driver's own marker for MPS client; the C is Compute. The tag is the kernel-visible confirmation that those processes do not hold their own device contexts. They submit CUDA work to the nvidia-cuda-mps-server daemon, and the daemon holds the single device context on their behalf. That is what MPS is, and how it gets higher utilization than time-slicing offers: many submissions, one context, the driver only ever sees one client per device. (Two nvidia-cuda-mps-server rows are visible in the screenshot. The count of server PIDs doesn't change the abstraction; there is still one MPS context per device.)
DCGM_FI_DEV_GPU_UTIL is keyed on the device, not the pod. One device, one row. To stamp that row with a pod label, the exporter joins the device UUID against the kubelet's PodResources socket, the same authoritative socket the last post named as the resilient join. Under one-pod-per-GPU that join is unique. Under MPS the PodResources reply carries four pods behind one device UUID, so the exporter has to pick one label for a row that physically can only be one row. The pick isn't stable across scrapes, which is what produces the flipping between tenant-a, -b, and -c above and the zero credit for tenant-d. The device counter is doing exactly what it is built to do: report what GPU 0 is doing as one number: a single utilization figure measured by the GPU's own hardware counters, with no per-tenant breakdown stored anywhere because the hardware never produced one. The 8% the first row above stamps with mps-tenant-b's name is not tenant-b's contribution; it is the entire device's activity from all four tenants combined, with one of their names arbitrarily attached. The information needed to split that figure across the four tenants does not exist at the device layer. It was collapsed inside MPS before DCGM ever saw it.
What MPS does not break
The GPU UUID is identical on every row: GPU-6e027708-.... MPS does not fragment device identity. The (node, UUID) half of the join model stays stable: one physical GPU, one stable UUID, regardless of how many tenants share it. The breakage is purely in the pod label: one device, one telemetry context, one name slot, four tenants.
That contrast matters for the next post. MIG, which the last post predicted would fragment the (node, UUID) key, is the symmetric case to MPS: stable pods, fragmenting device identity. Different attribution failure, same data model has to absorb both.
The case that didn't break: pod churn
The last post predicted pod churn would turn pod_uid="" from an oddity into an attribution problem. The reasoning sounded airtight: DCGM stamps metrics with the pod name, names recycle across Deployment rollouts, so when a pod is replaced the telemetry should briefly credit the dead pod before catching up. That prediction was wrong, and worth correcting on the record.
Test method: kubectl delete a running GPU pod, forcing the Deployment to terminate it and create a replacement with a new name and a new UID, while a 5-second scrape loop runs straight through the transition.
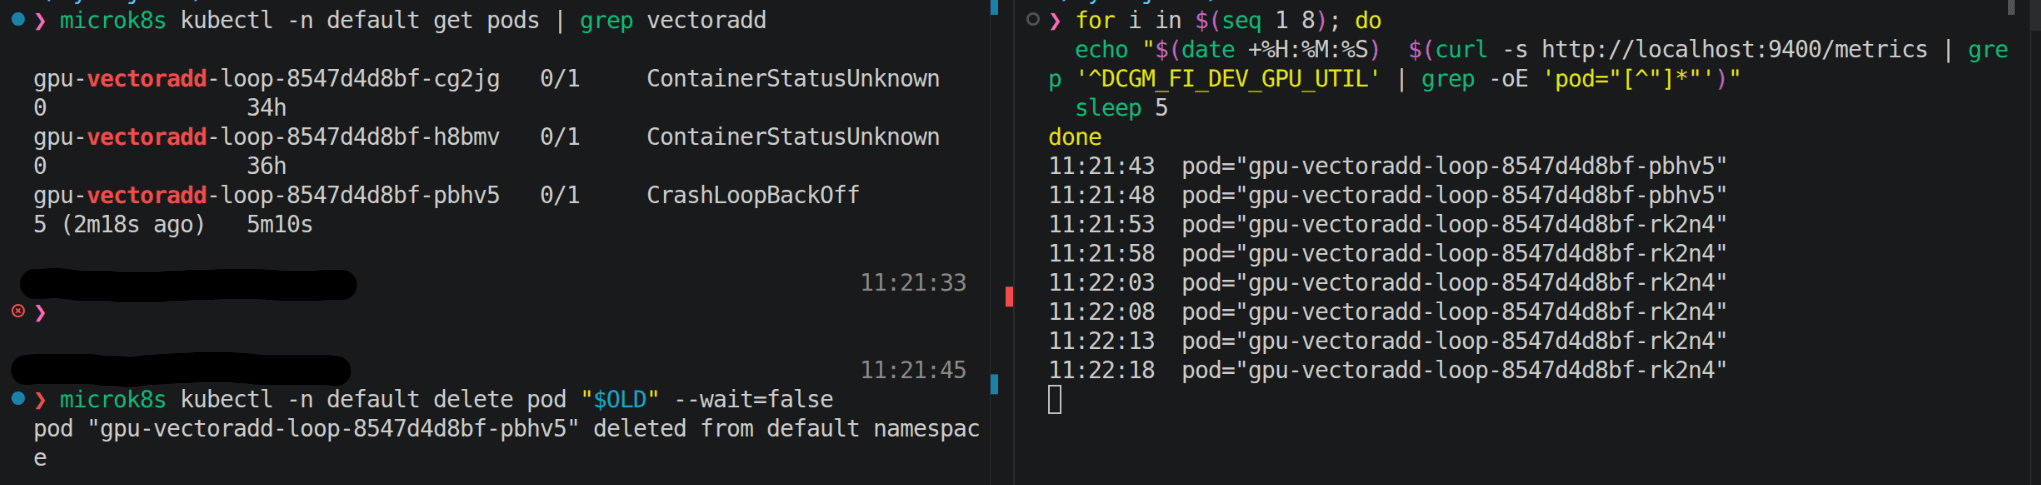
What plays out across that scrape loop is the pod lifecycle, not a telemetry artifact. The delete signals the pod to terminate, but the container keeps running through the termination grace period (default 30 seconds for a pod), and the kubelet keeps reporting that pod as the slot owner on its PodResources socket until grace ends. During that window DCGM correctly continues to credit the old pod, because the old pod is still alive and still holding the GPU. Once it terminates, the Deployment creates the replacement, the new pod takes the freed slot, and DCGM credits the new pod from the next scrape forward. The transition takes as long as the grace period takes; nothing inside DCGM lags.
There are really two churn modes, and neither breaks attribution:
- Container restart in place. With
restartPolicy: Always, a container that exits is restarted inside the same pod. Pod name and UID never change, so DCGM's name label is correct the entire time. A pod can showrestartCount: 200and the attribution is still accurate. - Pod replacement. Delete or evict a pod and the Deployment creates a new one with a new name and UID. DCGM tracks the slot's owner through the grace period and re-resolves to the new pod the moment kubelet hands over the slot. No mis-attribution window.
So the honest finding is the negative one: DCGM attribution by pod name is accurate throughout the pod lifecycle, including across churn. pod_uid="" is still real and still worth solving, but it is a join-correctness problem: pod names are not guaranteed unique over time and you cannot safely join name-keyed telemetry to the UID-keyed records the rest of Kubernetes uses. It is not a live-attribution problem. The resolution path the last post already named (resolve UIDs from the kubelet PodResources socket directly, not from DCGM's labels) remains correct. The framing was overstated.
What this means for Periscope Milestone 2
The last post framed the GPU view as a server-side join across five planes. This lab sharpens three specific rules for that join:
- For live attribution, DCGM's pod and namespace name labels are fine. They track churn correctly. Use them.
- For a correctness-safe join, resolve
pod_uidfrom the kubelet PodResources socket, not from DCGM. DCGM never populates it. Name-based joins are the fallback; UID-based joins are correct. - Under MPS, do not trust the per-pod number at all. The device metric credits one arbitrary tenant and flips between scrapes. The honest thing to show an operator is "N tenants are sharing this GPU; aggregate utilization is X%," with the allocation truth (four pods hold a slot, from PodResources) sitting next to the telemetry truth (one shared device figure). Fabricating a per-pod split under MPS would be inventing data the hardware layer cannot supply.
That third rule is the shape of the whole product. The allocation layer already knows the answer Kubernetes can know: which pods hold a slot on this GPU. The telemetry layer knows what the device is doing. A Kubernetes GPU view's job is to put those two truths in one view and be honest about the seam between them, instead of papering over the seam with a fake per-pod number that a flipping DCGM label would happily supply. A dashboard that draws four tenant lines and one of them is flat at zero is not surfacing a workload problem; it is surfacing the limit of the underlying telemetry, and a view that doesn't say so is misleading the operator who has to act on it.
What's next
MIG is the one case left, and it needs a real VM. The next lab moves to a short-lived A100, enables MIG, and watches what happens to the (node, UUID, pod) key when one physical GPU becomes seven logical ones with seven distinct UUIDs. The first post predicted MIG would fragment the (node, UUID) key; this post just showed that key staying stable while the pod label broke under MPS. MIG should do the opposite: stable pods, fragmenting device identity. If both halves can break independently, the data model has to survive either.