Ask a Kubernetes cluster a simple question: which pod is using this GPU right now? There is no honest one-line answer. Five different subsystems each own part of it, and none of them holds the full picture.
The device plugin knows what got allocated. DCGM knows what the hardware is doing. The kubelet knows which pod got which device. Node labels describe what kind of GPU sits on the box. The operator knows what it meant to deploy. Each of those is true. None of them is the whole truth.
That shape (five partial truths, one operator question) is what Periscope Milestone 2 is going to join. This post is the lab work behind it: what the boundaries actually are, what's hard about pulling them together, and one specific limitation worth calling out before pretending the answer is clean.
Reproducibility. This lab is microk8s on Ubuntu with a host-installed NVIDIA driver. microk8s enable dns gpu does the rest. The GPU addon deploys the NVIDIA GPU Operator into the gpu-operator-resources namespace and configures containerd to use the NVIDIA runtime. Full walkthrough: Canonical's GPU addon docs. The rest of this post is cluster-agnostic. The boundaries are the same on kubeadm, EKS, or GKE; one path detail differs and I call it out below.
The two mounts that tell the story
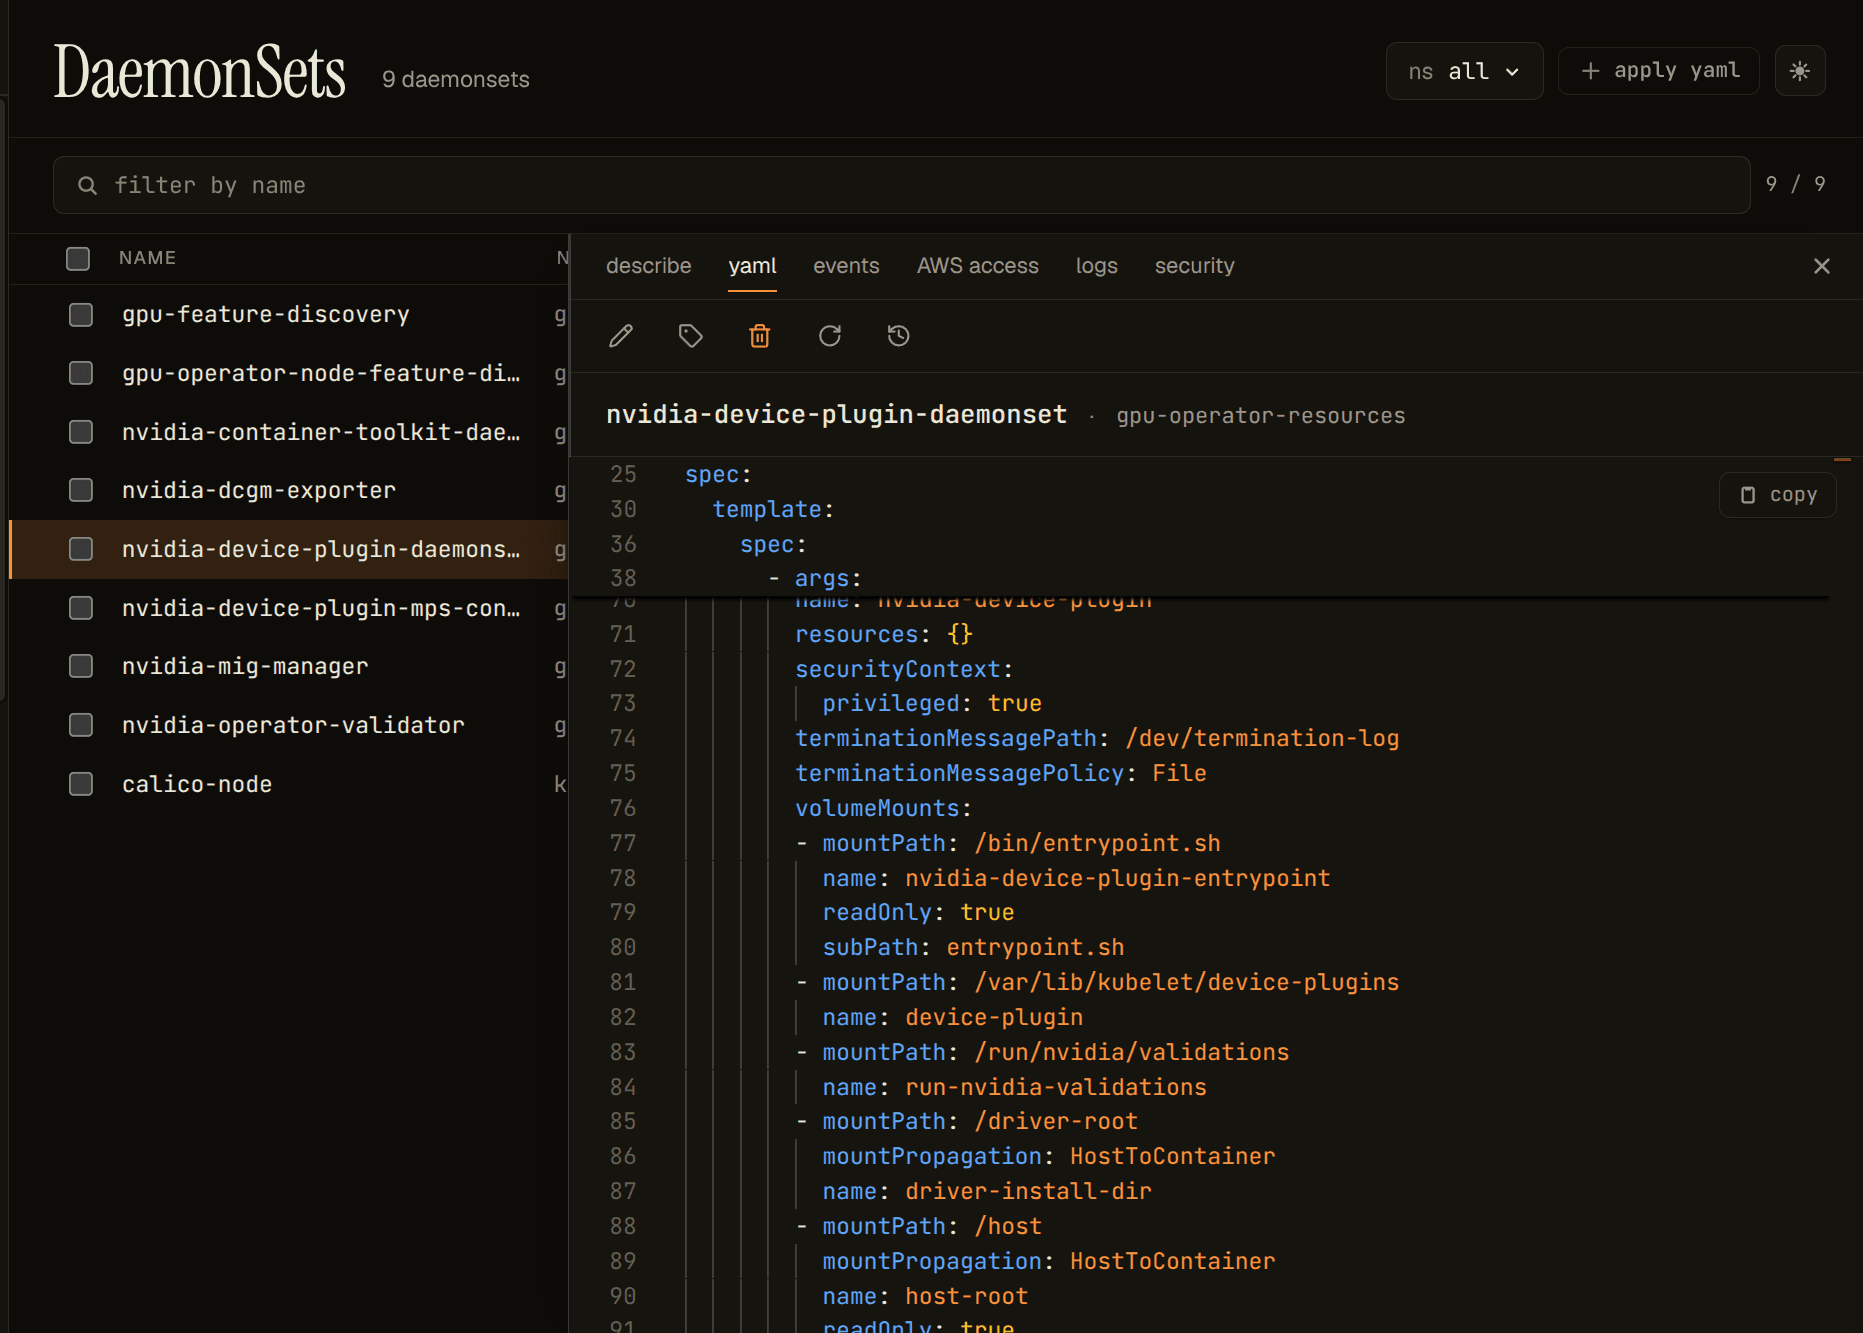
The framing that re-shaped my thinking was looking at where the relevant DaemonSets actually mount on the host. Two mounts told most of the story.
The device plugin mounts /var/lib/kubelet/device-plugins: the kubelet's device-plugin registration directory. This is the allocation boundary, where the plugin registers with the kubelet and participates in handing GPUs to pods. The answer to "which pod got the GPU" is decided here.
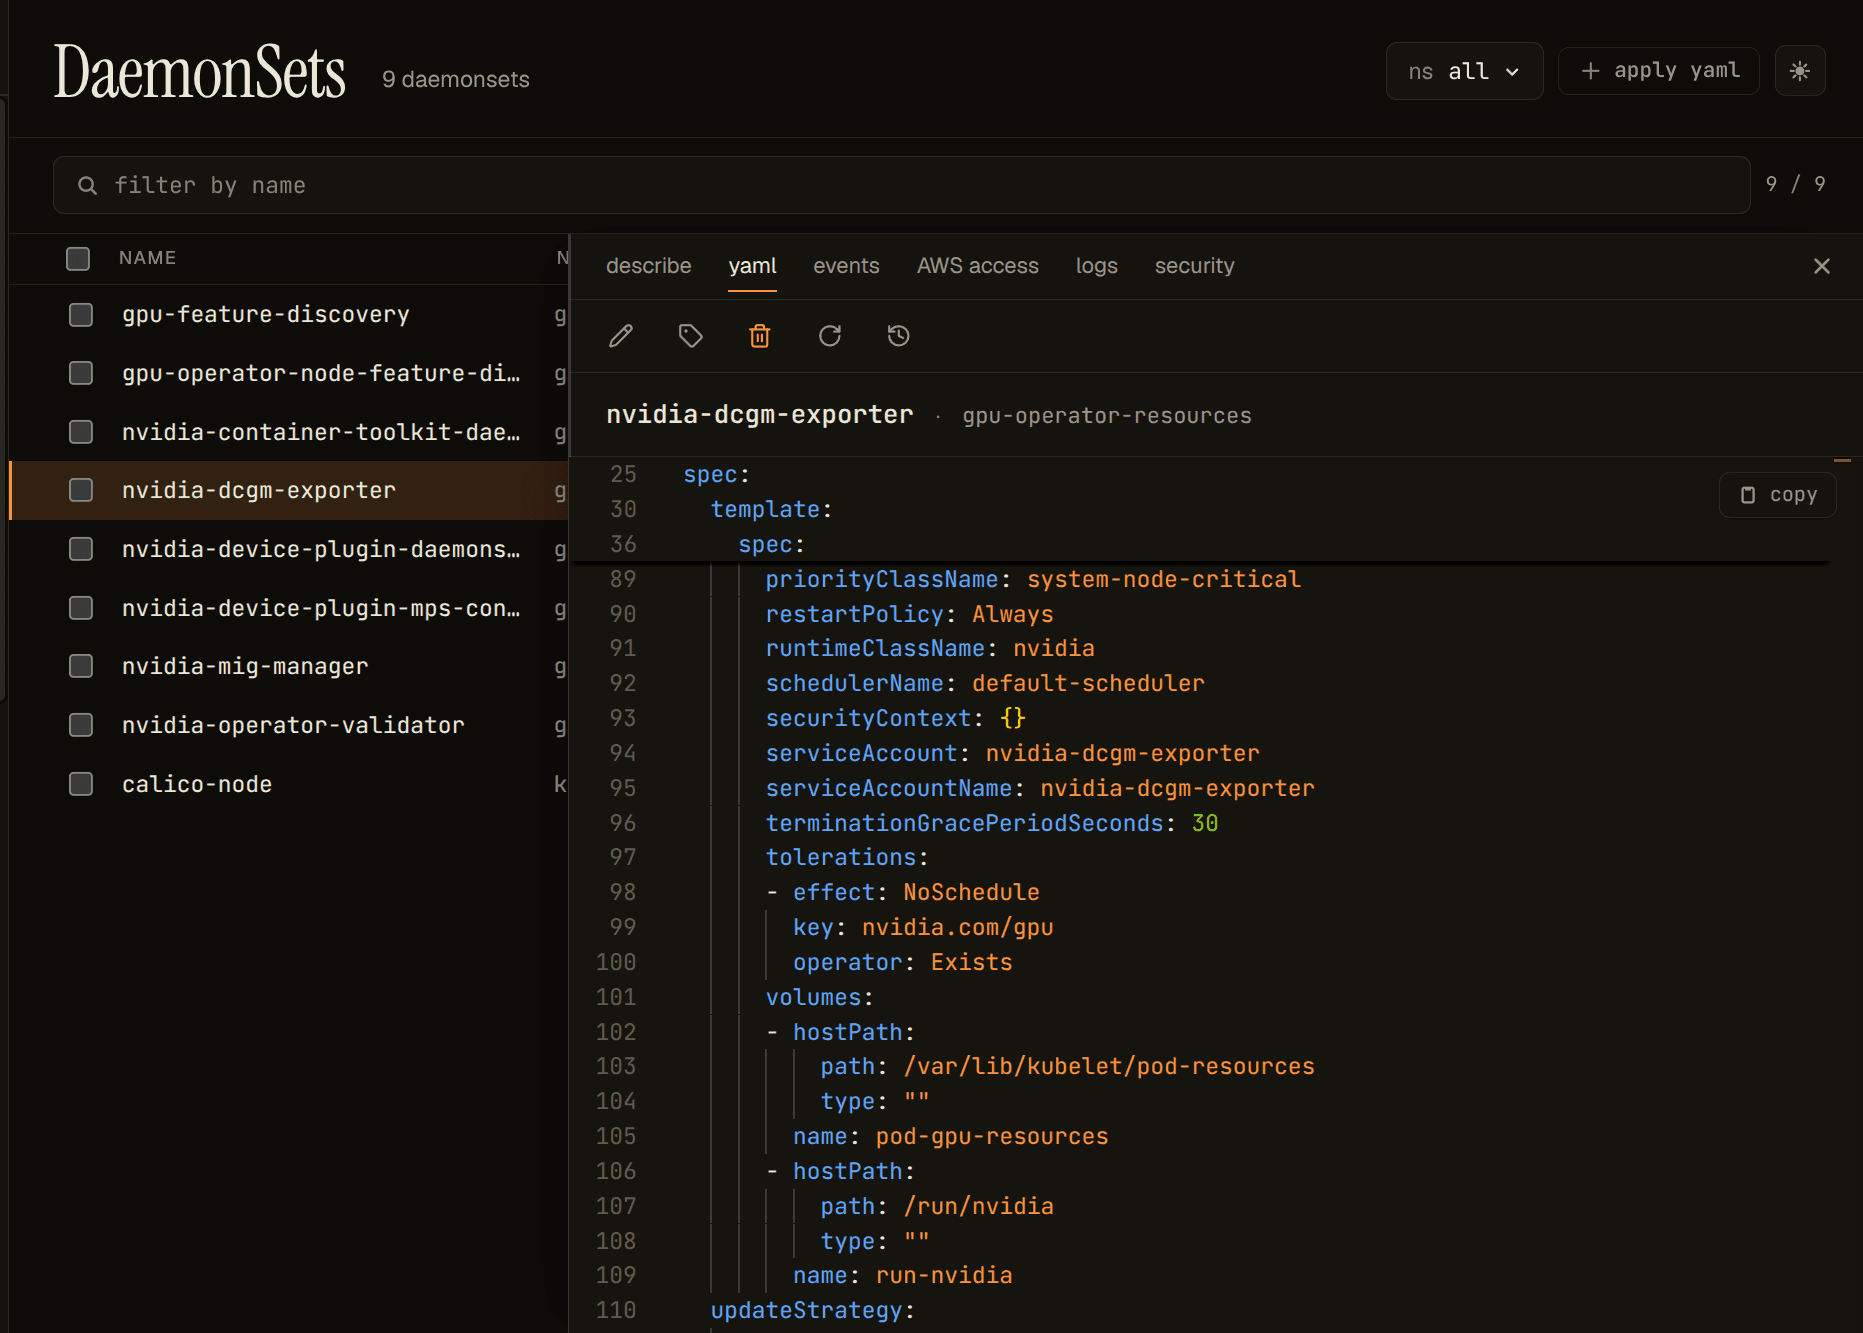
The DCGM exporter mounts /var/lib/kubelet/pod-resources: the kubelet's PodResources gRPC API. This is the attribution boundary, where the exporter asks the kubelet which pod owns each visible device, so it can stamp metrics with pod identity. The answer to "what is that pod doing with the GPU" joins through this socket.
Two mounts. Two boundaries. Two halves of the operator question.
A quick note on paths. The two directories above (/var/lib/kubelet/device-plugins and /var/lib/kubelet/pod-resources) are what you'll see on a standard kubelet install (kubeadm, EKS, GKE, vanilla on-prem). On the microk8s/snap install this lab runs on, the kubelet boots with --root-dir=${SNAP_COMMON}/var/lib/kubelet, so the host-side paths nest under that prefix: /var/snap/microk8s/common/var/lib/kubelet/device-plugins and /var/snap/microk8s/common/var/lib/kubelet/pod-resources. Same boundaries, same role, different prefix: the NVIDIA GPU Operator's kubeletRootDir Helm value is what makes the operator's DaemonSets mount the right one. If you're following along on microk8s and the mounts in your DaemonSets don't look like the screenshots, this is the first thing to check.
Everything else in the operator's stack (ClusterPolicy, GFD/NFD labels, the validator, the toolkit installer) is in service of these two boundaries being healthy. That re-frames the operator's failure modes: most of them are not "the GPU is broken," they're "one of these two boundaries isn't reachable yet."
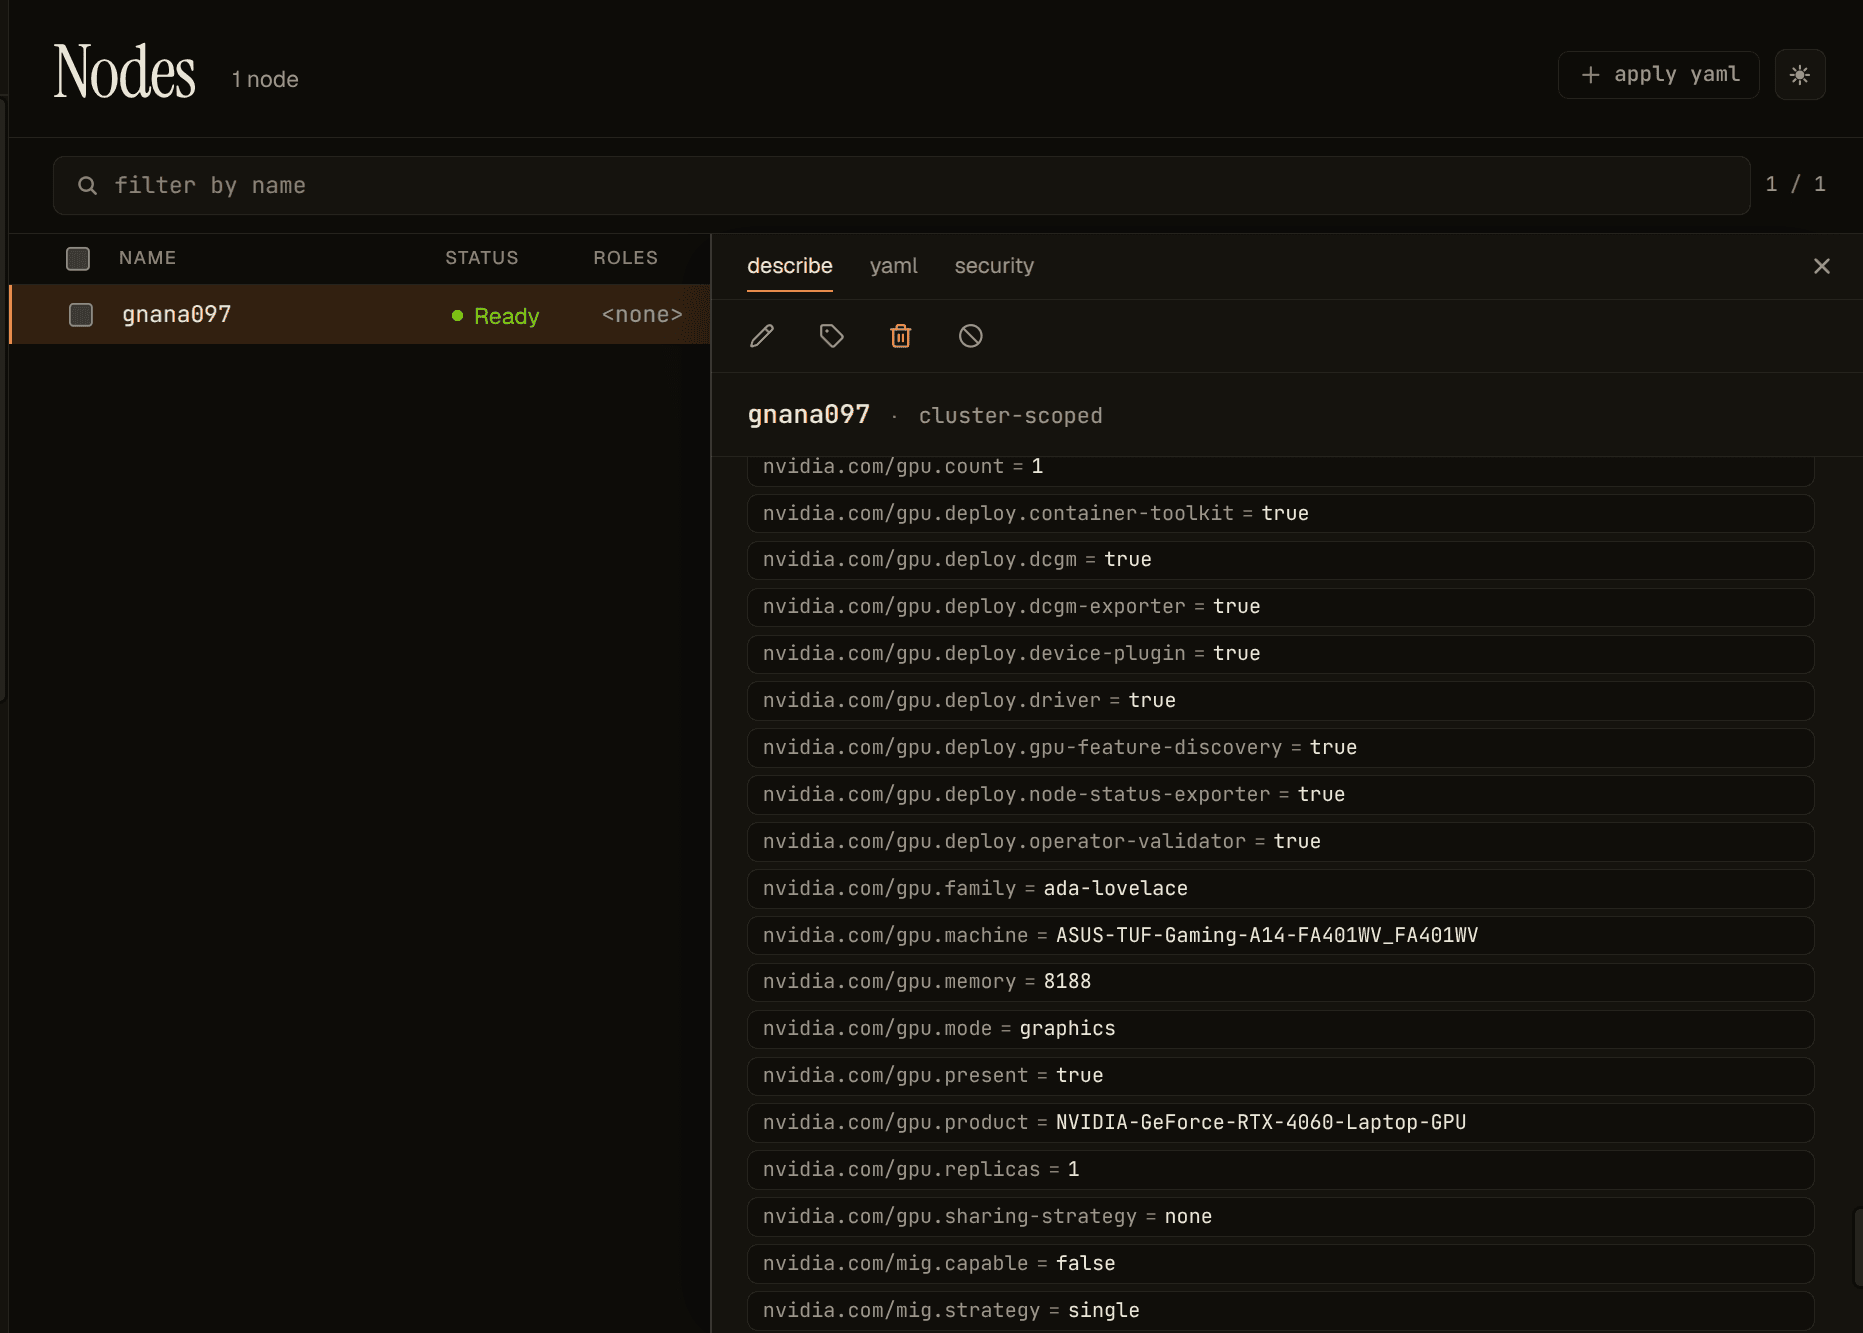
Sitting next to the two boundaries is the description plane, where GFD and NFD stamp GPU model, capability, MIG strategy, and driver version onto each GPU-bearing node as labels before any workload runs:
Two scrapes
To verify those boundaries I set up the operator on a single-GPU laptop and ran a CUDA vector-add deployment requesting nvidia.com/gpu: 1.
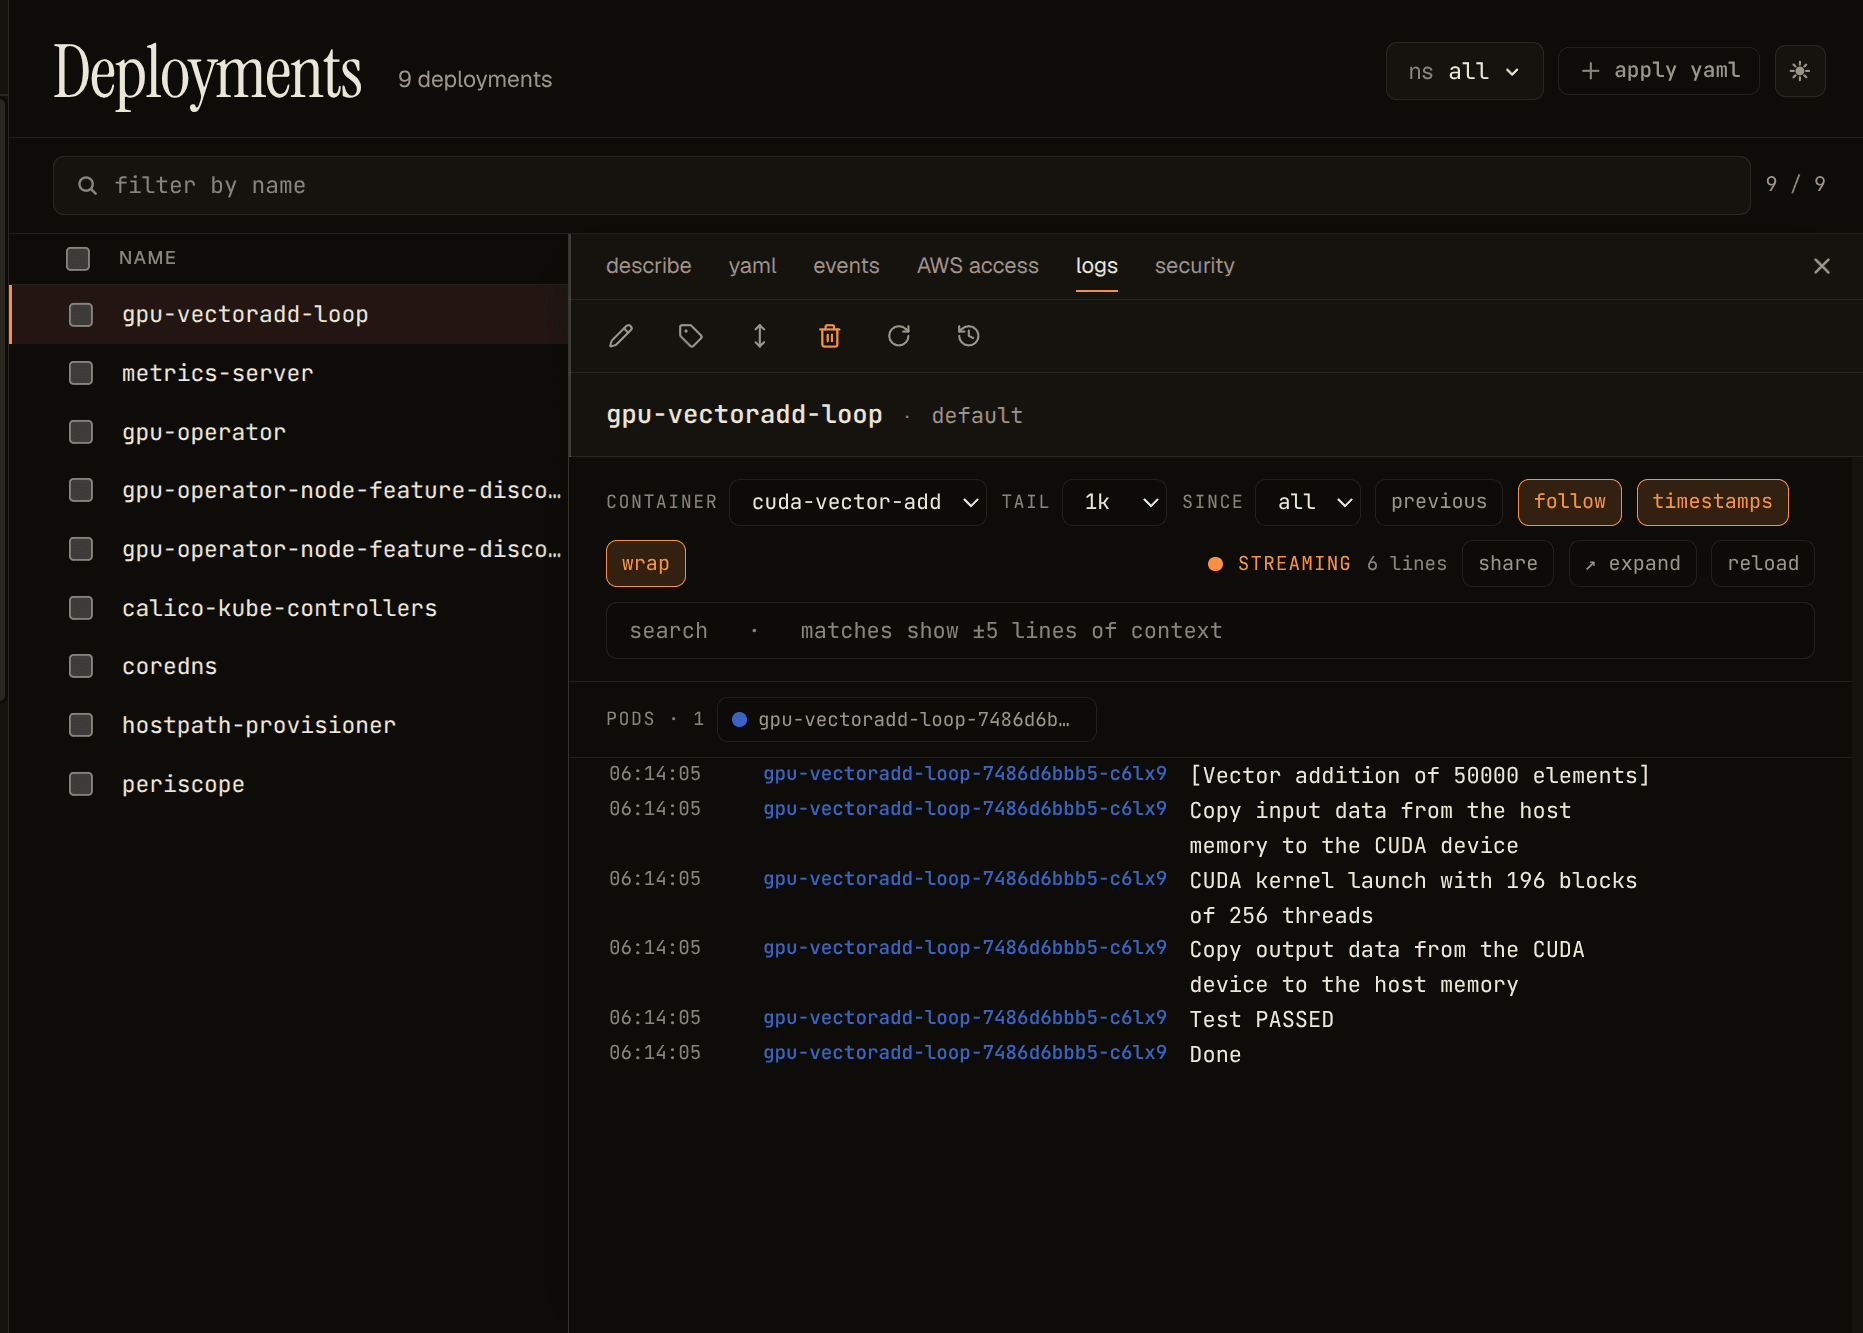
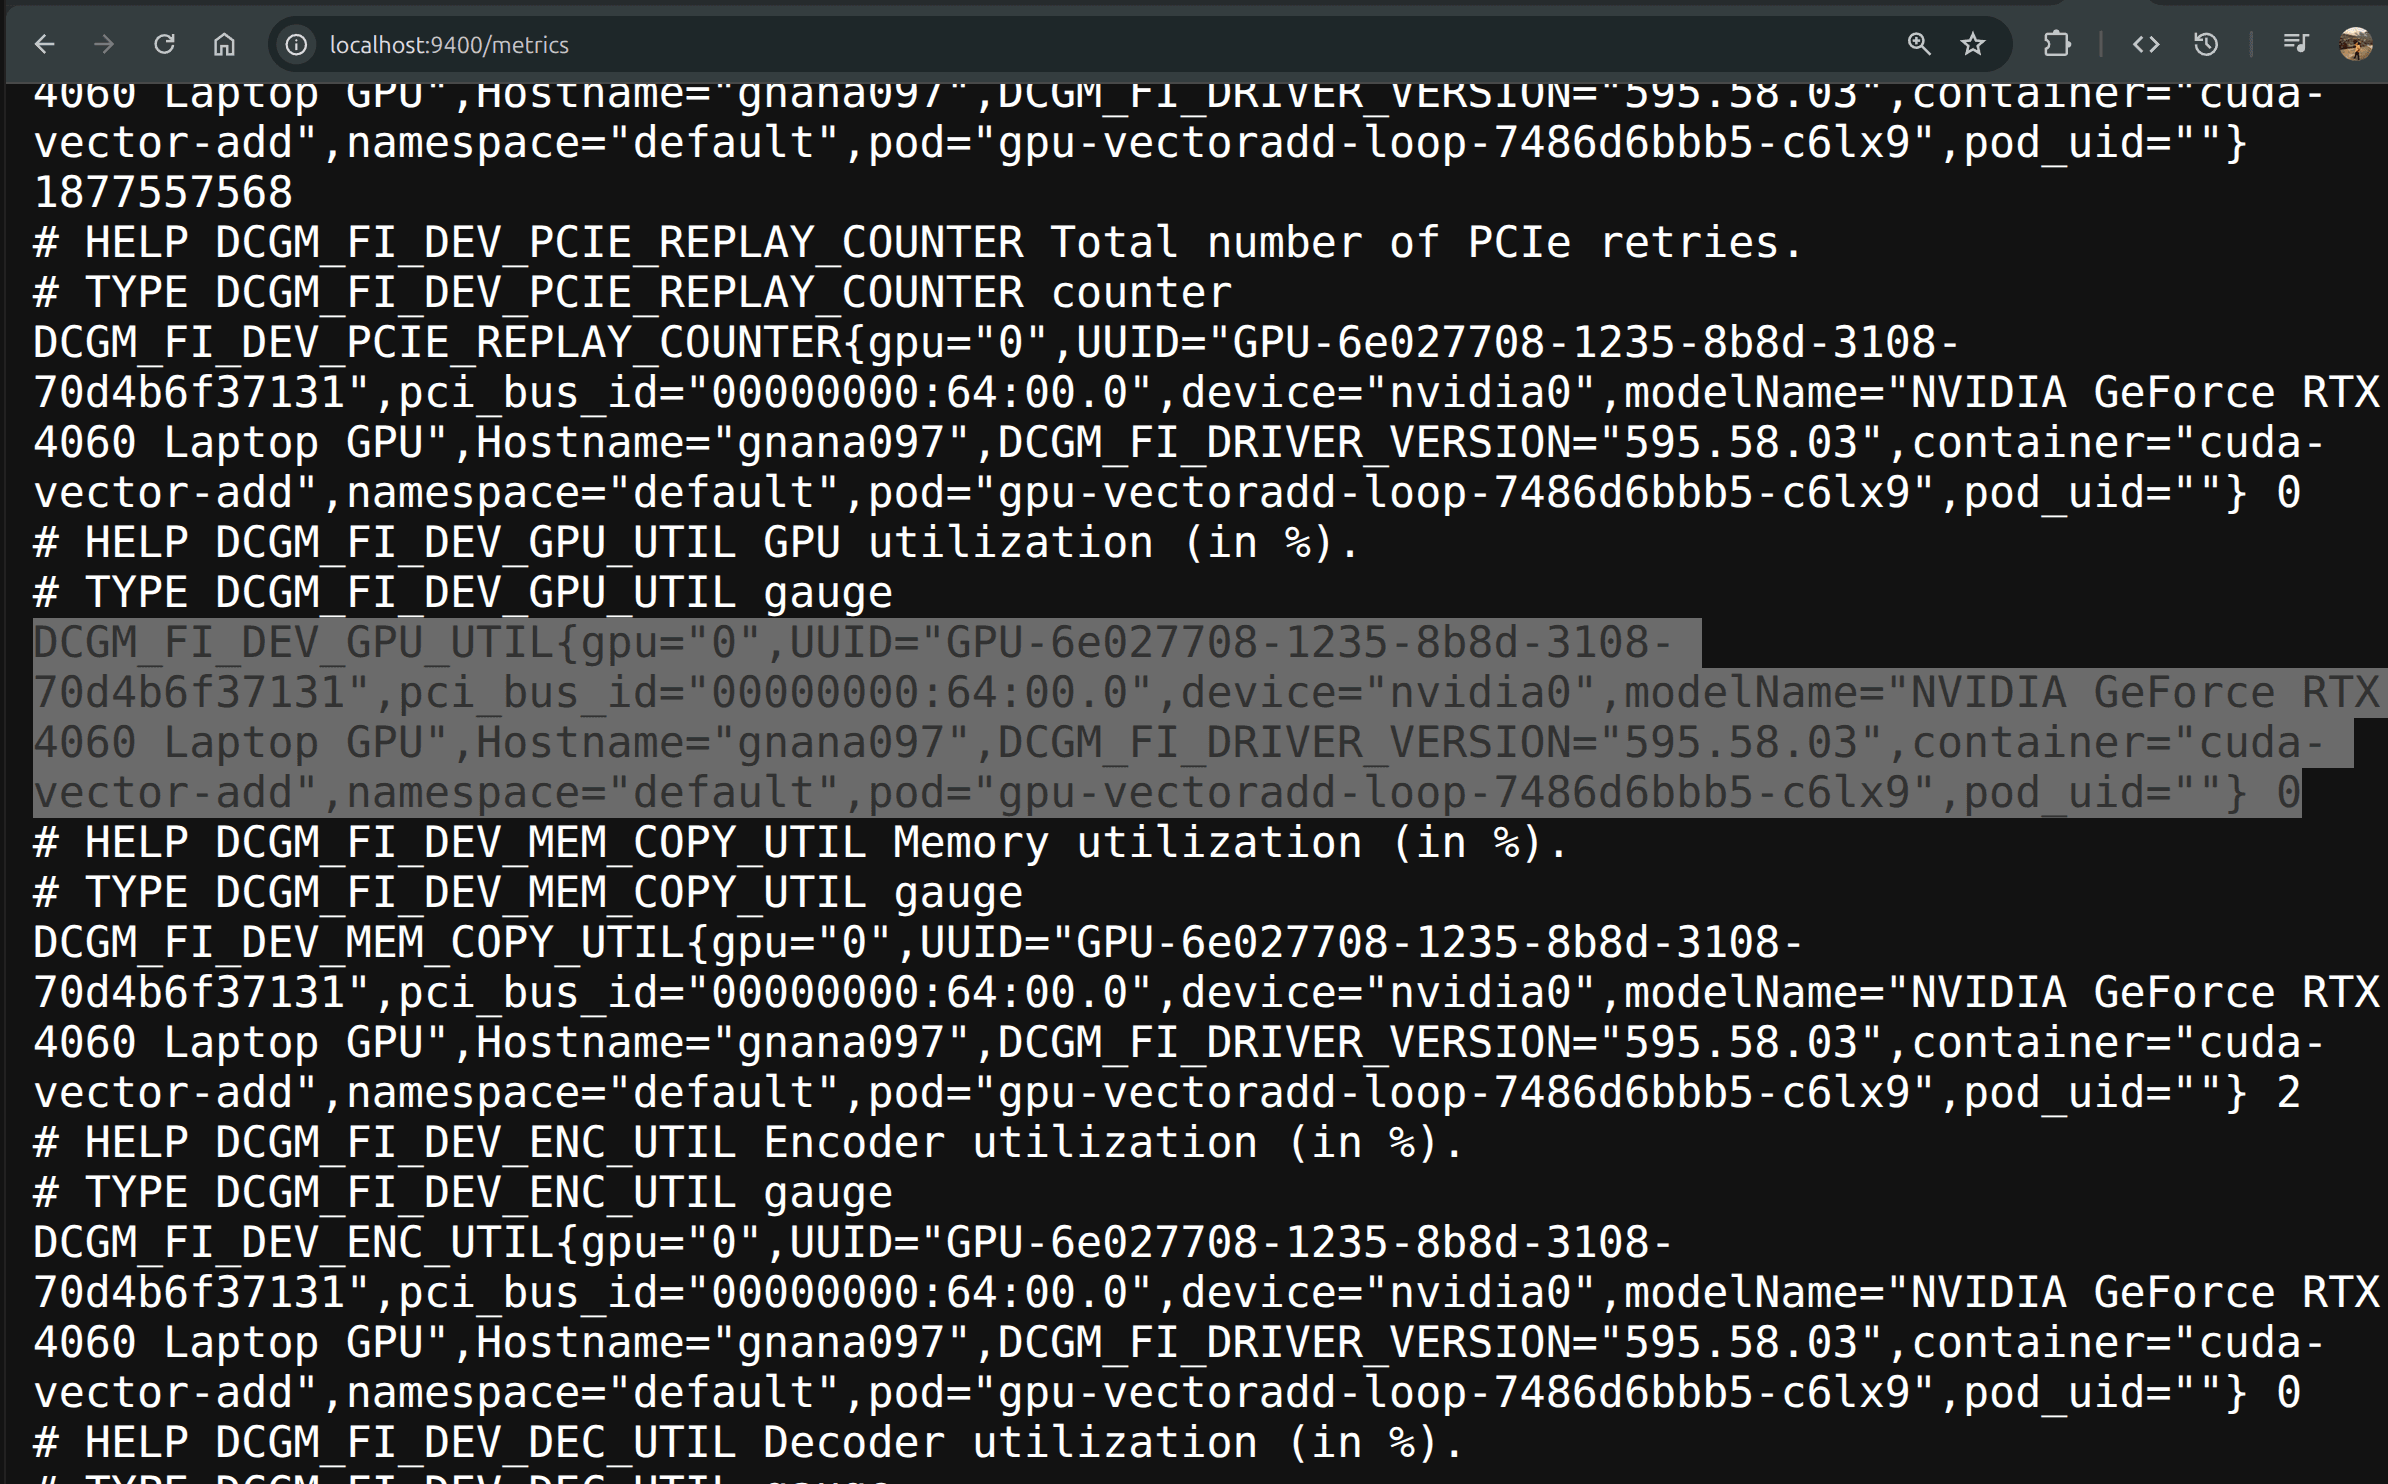
Before the workload ran, the DCGM scrape was device-centric:
DCGM_FI_DEV_GPU_UTIL{gpu="0",UUID="GPU-…",pci_bus_id="00000000:64:00.0",
  device="nvidia0",modelName="NVIDIA RTX 4060",Hostname="gnana097"} 11
DCGM saw the GPU, the exporter was healthy, all the hardware identity was present. But the workload-identity columns (pod, namespace, container) were absent. There was nothing to join to.
After the workload ran, the same metric family carried the join:
DCGM_FI_DEV_GPU_UTIL{
  gpu="0", UUID="GPU-…", Hostname="gnana097",
  container="cuda-vector-add",
  namespace="default",
  pod="gpu-vectoradd-loop-7486d6bbb5-7dmmt",
  pod_uid=""
} 12
The number 12 isn't the point. The point is that one row now ties a physical GPU identity (UUID), a node (Hostname), a workload identity (namespace/pod/container), and a live hardware counter — through one scrape. That single row is the shape of the data Periscope needs to assemble.
The boundary that didn't fully close: pod_uid
In that enriched scrape, look at one label: pod_uid="". The pod name, namespace, and container all populated. But the stable identifier did not.
This is not a local misconfiguration. It's a known long-running gap in dcgm-exporter. The kubelet's PodResources gRPC has two endpoints: GetAllocatableResources returns devices but no pod UID, while List returns pod UIDs alongside devices. Several exporter versions discover via the no-UID path. Multiple GitHub issues against NVIDIA/dcgm-exporter describe variants of this gated on exporter version, kubelet version, and config flags.
It matters because pod names recycle. A Deployment churning replicas produces gpu-vectoradd-loop-7486d6bbb5-7dmmt today and gpu-vectoradd-loop-7486d6bbb5-9k4qx tomorrow. Joining historical telemetry across pod restarts cleanly needs a stable handle, and on Kubernetes that's the pod UID. If the exporter doesn't propagate it, the join has to either fall back to (namespace, pod-name) and accept reuse collisions, or correlate UIDs from a second source: the apiserver, or the PodResources socket directly from Periscope's own backend.
That second option is the more interesting one for a product view, and it's an explicit design point for Milestone 2. The exporter is the easy join; the resilient join walks both sides.
A useful detour: container runtime ≠ host driver
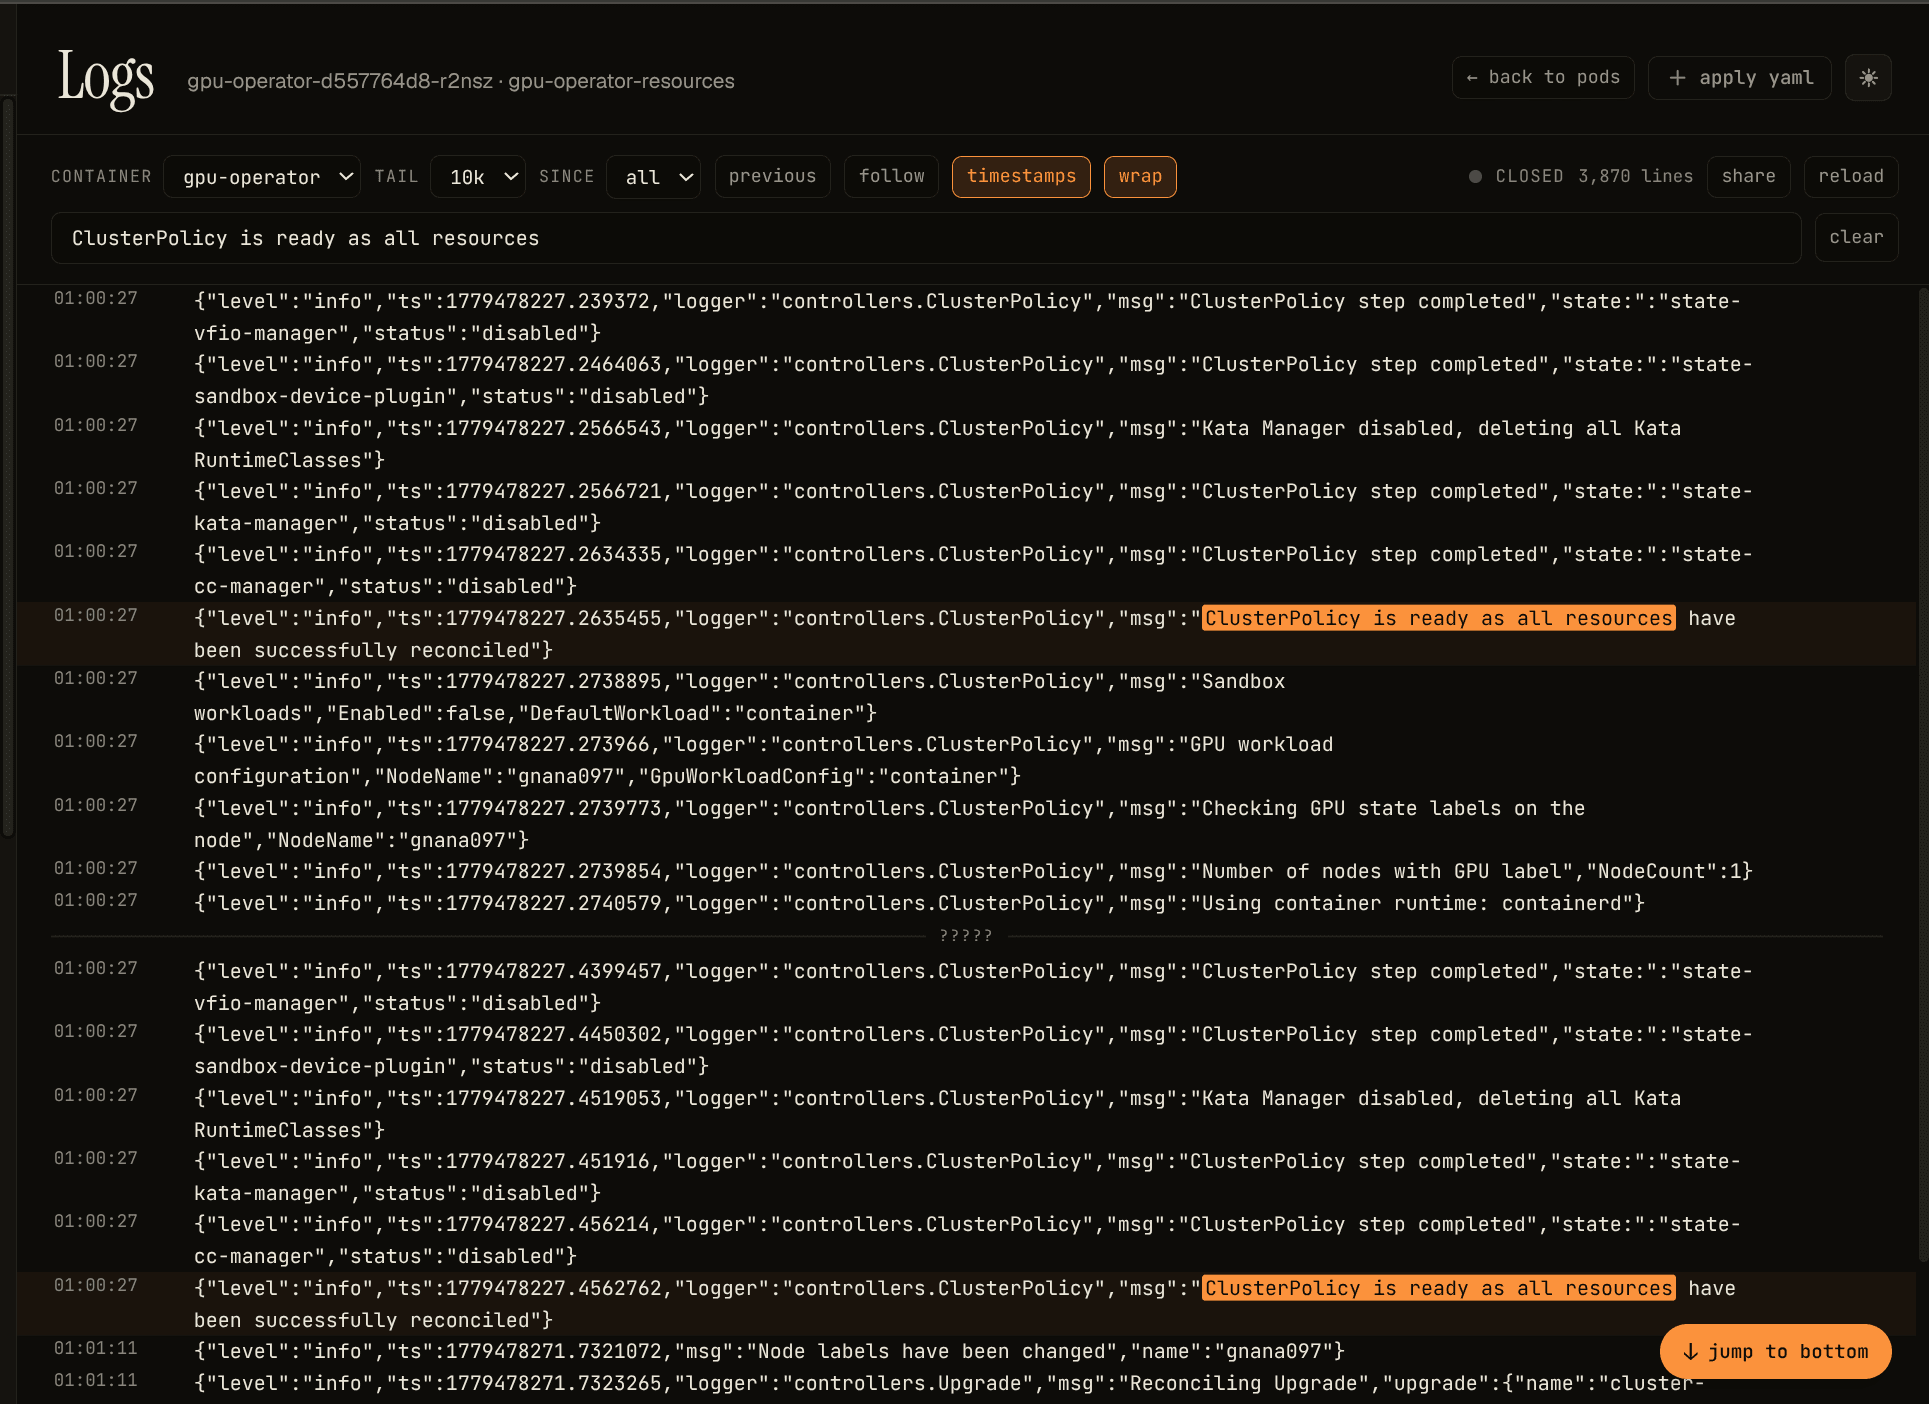
One paragraph for a thing that cost me an hour. The first install came up loud. ClusterPolicy reported "not ready, states not ready: [state-operator-validation state-device-plugin state-dcgm-exporter gpu-feature-discovery]", and at a glance it looked like four things were broken at once. The real cause was lower and meaner: the NVIDIA container toolkit / runtime integration wasn't installed correctly. The host driver was fine (nvidia-smi worked), but every containerized GPU path downstream was blocked. The lesson is small but worth keeping: host GPU functionality and containerized GPU functionality are different layers. The operator can't fix the second if the first isn't there, and it can't wire the runtime path between them either.
For reference, the working ClusterPolicy had host-managed driver, operator-managed toolkit and telemetry, and MIG present but defaulted off:
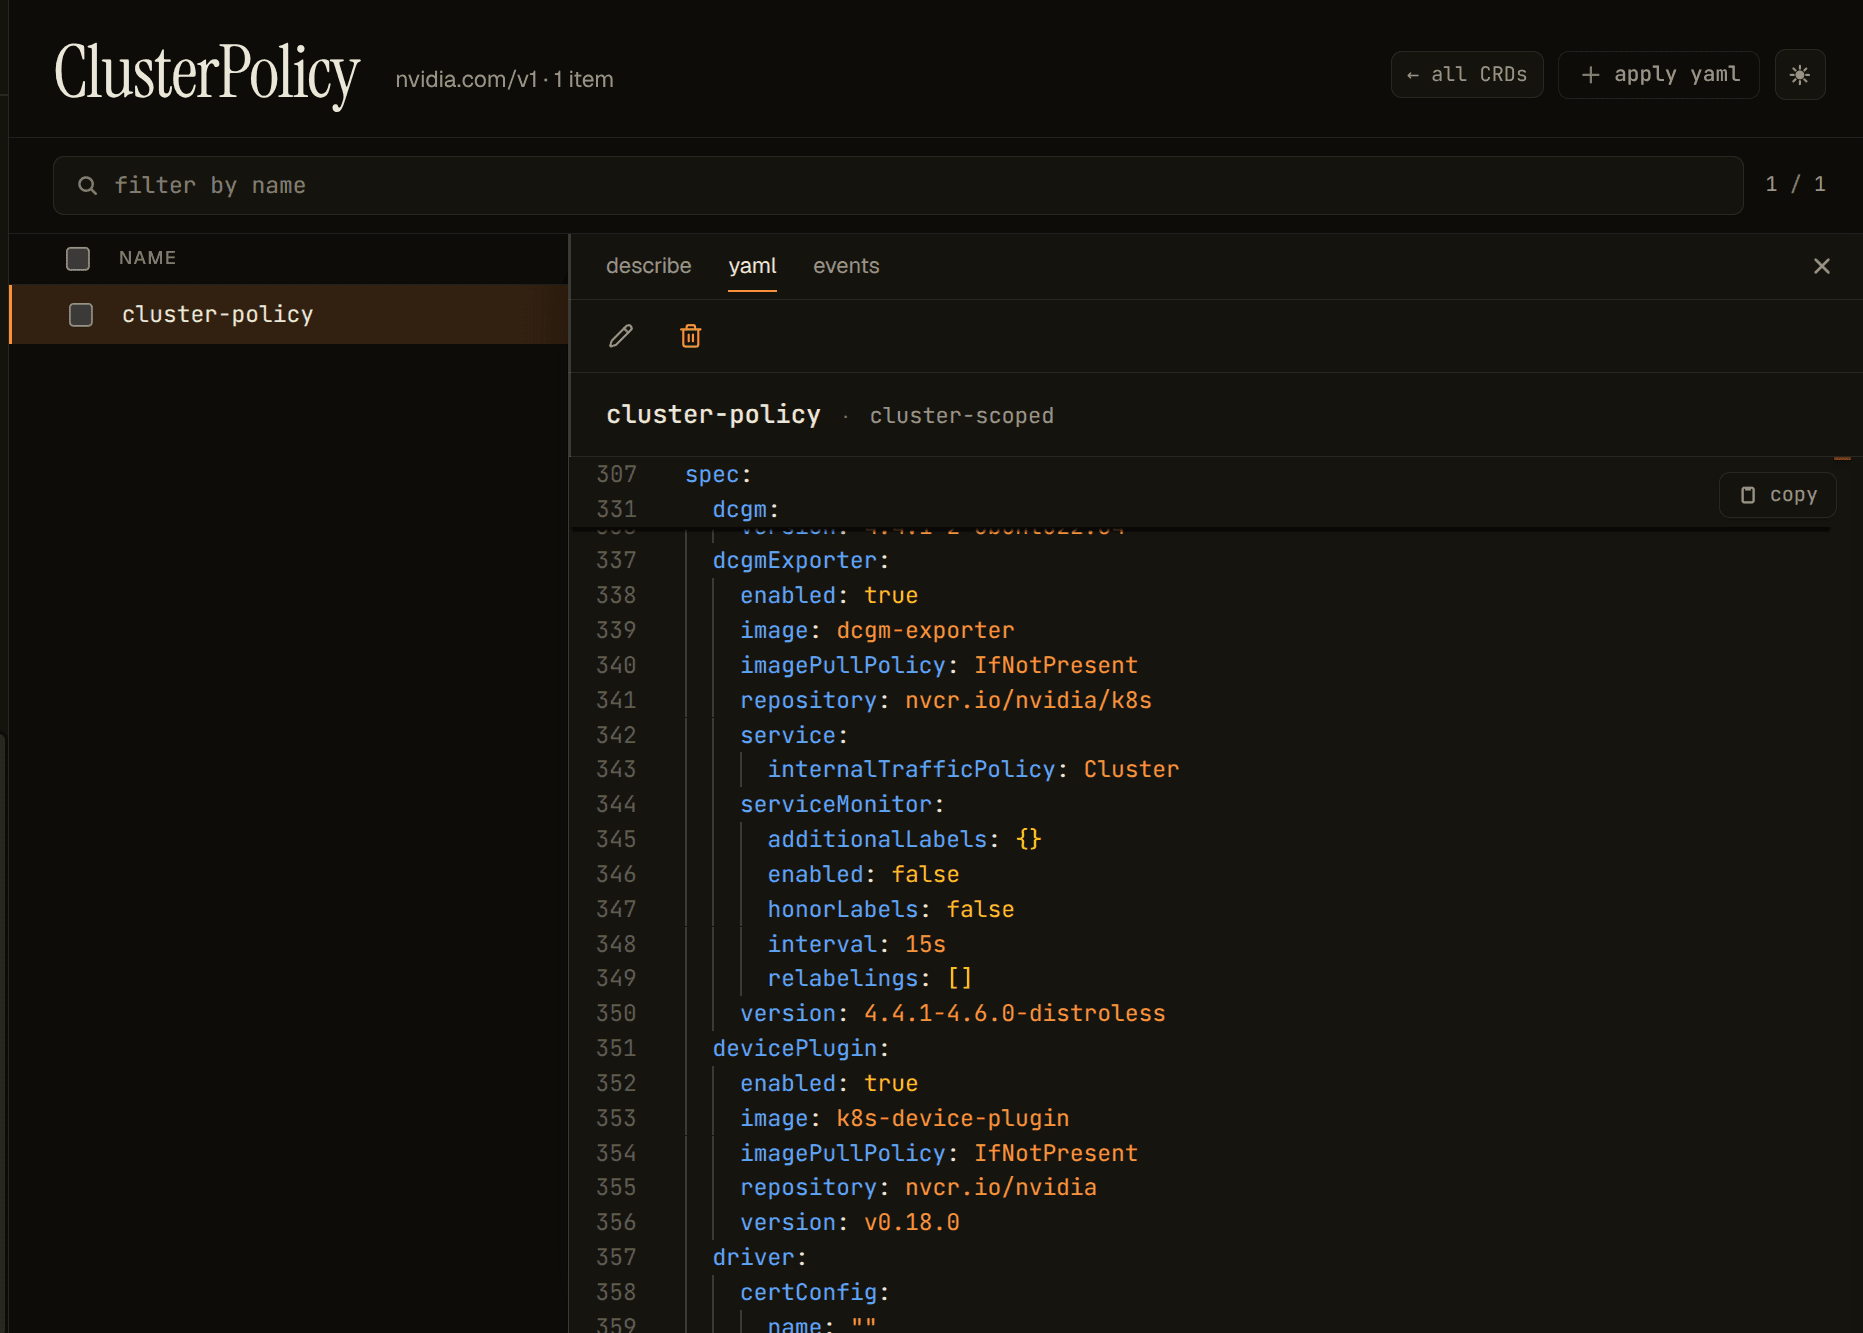
…and once the runtime path was wired correctly, the operator reconciled every operand:
What Periscope's view will do that DCGM + Grafana doesn't
You can already run the operator, scrape DCGM, and build a Grafana dashboard for utilization, memory, power, and temperature. That is useful. It still doesn't answer the operator's question.
The operator question is not "what does GPU 0 look like." It is closer to four overlapping questions, each of which is a join, not a metric:
- Which workloads are allocated to GPUs but mostly idle? A join across allocation truth (PodResources) and telemetry truth (DCGM utilization), filtered to "allocated but consistently below threshold." This is the question cost-attribution conversations live or die on.
- Which pod is on which physical GPU, and what's it doing right now? PodResources × DCGM × node identity, one row per pod-GPU, sortable by anything.
- Which device is hot, memory-bound, or throwing XIDs, and who owns that failure? DCGM XID and framebuffer joined to the workload owner, not just the device.
- What did the operator intend versus what's actually reconciled?
ClusterPolicyversus operand status, in the same view as the runtime telemetry. So a deliberately disableddcgm.enableddoesn't show up as "nothing here, must be broken."
Each of these is a join. None of them is an additional metric. Periscope's GPU view is going to look the way its IAM, CVE, and Karpenter views already look: one screen, multiple planes joined server-side, framed around the operator question.
The infrastructure half of Milestone 2 is the data model that survives pod churn, MIG, and MPS, including the pod_uid boundary above. The product half is the view that makes those joins feel like one thing.
What's next
Three cases this lab deliberately did not stress:
- Pod churn: pod-UID propagation, name reuse, attribution flapping on Deployment rollouts.
- MIG slicing and MPS sharing: MIG turns one physical GPU into many logical ones with their own UUIDs; MPS lets multiple containers share one. Either way the
(node, UUID, pod)model from this post fragments. - Multi-tenant clusters: where allocated-but-idle stops being a curiosity and becomes a quarterly cost line.
A note on hardware. Two of those (MIG slicing and real multi-tenant pressure) need datacenter hardware a laptop GPU can't deliver. The follow-up lab moves to a short-lived A100 or H100 on GCP or AWS, where MIG instances and serious co-tenancy actually exist. Pod churn is the only case that's reproducible on the existing rig.
The next post takes the model from this one — (node, UUID, pod) — and stresses it on a rented A100. MIG fragments the (node, UUID) key. MPS breaks the "one row per pod-GPU" assumption. Pod churn turns pod_uid="" from an oddity into a real attribution problem. What survives any of those, and what the data model has to become to absorb the rest, is what's coming.
The raw data is already there. It's in five different places. Whether the operator gets five Grafana panels or one cluster view is the product decision Milestone 2 is going to make.